Updated April 3, 2023
Introduction to spring boot debug
Spring boot debug is the most important tool which was used to write the software. We can debug our application by using eclipse and spring tool suite. The java virtual machine does not enable debugging by default due to the java virtual machine (JVM). It will be creating additional overhead inside into the java virtual machine. It is also a security concern for application which was publically accessible.
What is spring boot debug?
- Basically, application debugging is performed at the time of development; it was not performed in a production environment.
- Before running debugging on the application environment, first, we need to configure the java virtual machine on the application server for running debugging.
- We can also enable the debugging by command-line tool or do this by using IDE. For example, the command to set the command line argument for a java virtual machine is as follows.
-agentlib:jdwp (java debug wire protocol) = transport = dt_socket, server=y, suspend = n, address = 8000- Agentlib jdwp is used to enable the java to debug wire protocol inside into the java virtual machine. This is nothing but the main command line argument which was used to enable the debugging.
- Transport dt_socket is used in a network socket to debug the connections. Other option of Unix socket and shared memory contains the other application options.
- The server contains the value as Y, which was used to listen to the debugger connection. While setting the server debugger connection value as N, this process will try for connecting to the debugger instead of the incoming connection.
- Suspend contains the value as N; this parameter doesn’t wait for debugging connection at the startup. Instead, the application will start normally at the time when we have attached the debugger.
- While setting address as 8000, while setting network port which was java virtual machine is listening from the debug connection.
- The values from the standard and it will work in most the cases which were used in operating systems.
- As we know that spring boot application is starting in different types. We can also start the spring boot application by using –jar options.
How to spring boot debug?
- Below are the steps which were shown on how to debug the spring boot application are as follows.
- Build the application service by using debug mode.
- Modify the application docker file to expose the port of debug into the image of docker. After modifying the image of the docker, run our application in the mode of debug.
- After modifying the docker image, the next step is to deploy the docker container while using the debug container exposed.
- After deploying the docker container, the next step is to debug the session using the spring tool suite or eclipse.
- At the time of debugging the spring boot application, we need to compile the service using additional information after enabling the debugging while runtime.
- We can be done it by adding the same by using the javac parameter, -g is the build script of our spring boot application.
- We can also enable debug logging by enabling the same. Enable debug logging it doesn’t mean displaying all the logs at debug level.
- After enabling debug log, it will display useful information related to the initialization of the container, so we need to check which beans we need to create using configuration.
Spring Boot Applications debug
Below examples shows to create war file of spring boot project are as follows.
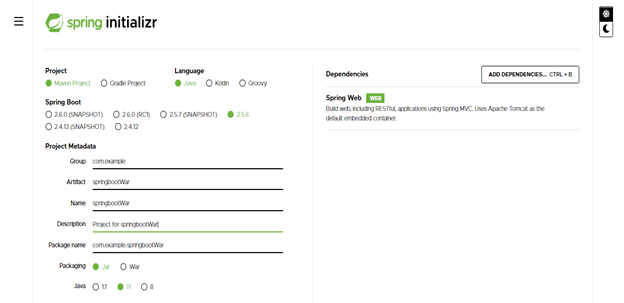
- Create project template using spring initializer and give a name to project –
In the below step, we have provided project group name as com.example, artifact name as springbootWar, project name as springbootWar, and selecting java version as 11.
Group – com.example
Artifact name – springbootWar
Name – springbootWar
Description – Project for springbootWar
Spring boot – 2.5.5
Project – Maven project
Java – 11
Package name – com.example.springbootWar
Dependencies – spring web.
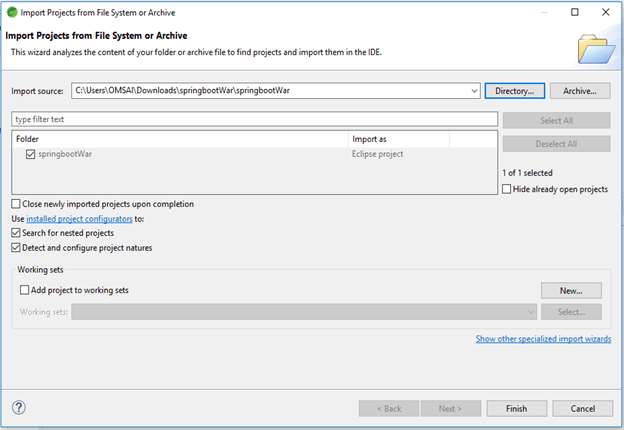
- After generating project extract files and open this project by using spring tool suite –
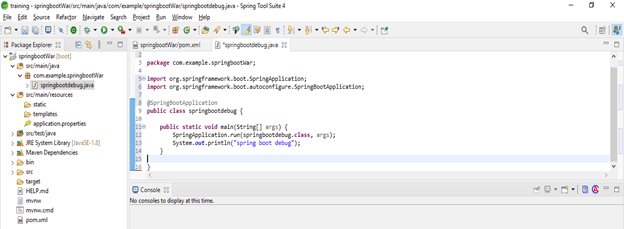
- After opening the project using the spring tool suite, check the project and its files –
- Create the main class –
Code –
@SpringBootApplication
public class springbootdebug
{
public static void main(String[] args)
{
SpringApplication.run (springbootdebug.class, args);
System.out.println ("spring boot debug");
}
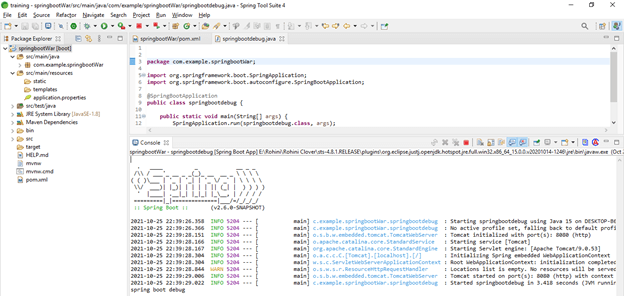
}- Debug the application –
Spring Boot Debug Servers
- Spring boot debug server provides the script for stopping and starting the application.
- Below is the spring boot debug server are as follows.
- Tomcat
- Wildfly
- Web logic
- Glassfish
- Jetty
- We can start the tomcat server by using the execution file name as Catalina.sh. For example, to start debug server by using tomcat server, we are using below command are as follows.
# catalina.sh jpda start- Default argument of tomcat server is using the network socket which was listening to the port by using 8000 with suspend parameter as N.
- We can start the wildfly server by using the execution file name as stand-alone.sh. To start the wildfly server by using debug enables, we need to add debug.
- We can start the web logic server by using the execution file name as startWeblogic.sh. To start the web logic server by using debug enables, we need to set the environment variable to debug flag as true.
- We can start the glassfish server by using the execution file name as asadmin. To start the glassfish server by using debug enabled, we need to use debug.
- The jetty application server does not come with a startup script. However, we can starting the jetty server by using the java command.
Spring boot debug types
- We can configure the spring boot to debug the application by configuring the application.properties file.
- We can also debug our spring boot-microservices which were hosted on the docker container.
- We can start our local application by enabling the debug mode on of our spring boot application.
- By using debug mode enables we can debug the spring boot application, which was hosted on a remote server.
- Below is the type of remote debugging is as follows.
- Start application locally by using debug mode.
- Start uberjar in debug mode.
- Start the application on the open shift in debug mode.
- Attach debugger to application.
Conclusion
Spring boot debug is the most important tool which was used for writing the software. We can debug our application by using eclipse and spring tool suite. Before running debugging on the application environment, first, we need to configure the java virtual machine on the application server to run debugging.
Recommended Articles
This is a guide to spring boot debug. Here we discuss the steps which show how to debug the spring boot application along with the examples. You may also have a look at the following articles to learn more –
