Differences Between SPSS vs Stata
SPSS, abbreviated as Statistical Package for Social Sciences, was developed by IBM, an American multinational corporation, in the year 1968. SPSS is a statistics software package that is mostly used for interactive statistical analysis in the form of batches. SPSS has licensed software that can be used as trialware or SaaS (Software as a Service). SPSS supports different operating systems such as Windows, Mac OS, Linux on z Systems, UNIX and Linux.
Stata is a general-purpose software package for statistical analysis developed by Stata Corp in the year 1985. Stata is a proprietary licensed product that William Gould initially authored. Stata supports different operating systems such as Windows, Mac OS, and Linux.
SPSS was initially long created by SPSS Inc. but later acquired by IBM Corporation in the year 2009 and was named as IBM SPSS Statistics Package. IBM SPSS software is a leading software that helps or provides in finding a customer or end-user data insights. SPSS contains a comprehensive set of statistical tools, easier statistical analysis, and open source integration.
Stata is primarily a data analysis and statistical software which provides a solution for data science needs, retrieves and manipulates data, visualizes data model, and generates or produces useful reports. Stata is a powerful statistical software package tool for data management, data analysis, and graphics.
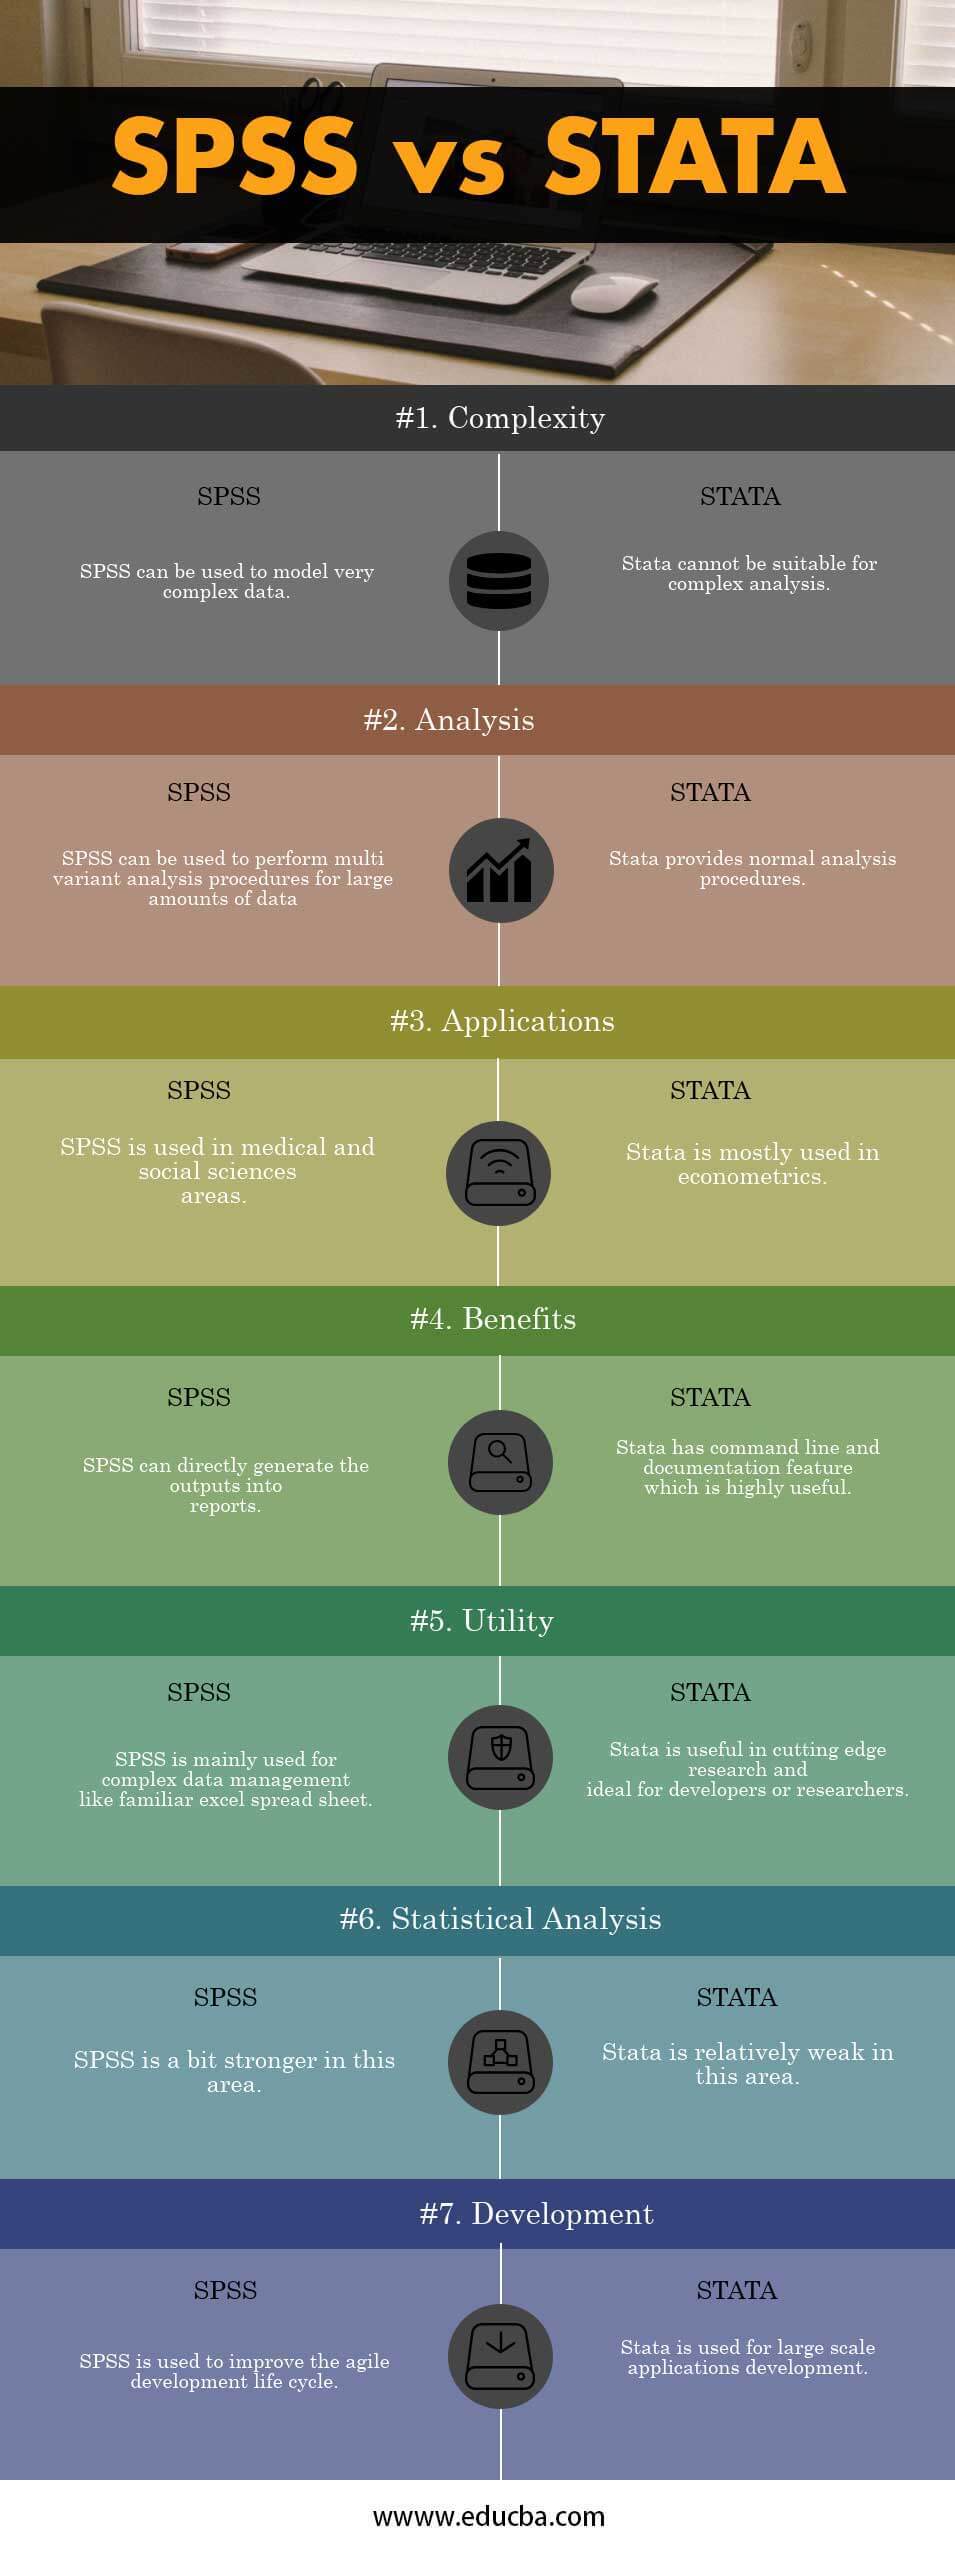
Head to Head Comparison Between SPSS and Stata (Infographics)
Below is the Top 7 comparison between SPSS and Stata:
Key Differences Between SPSS and Stata
Below are the lists of points, describe the key Differences Between SPSS and Stata:
1. The key features of SPSS include forecasting and decision trees on data, base edition, advanced statistics and custom tables add-on package, statistics and charting capabilities, complex sampling and testing add-on whereas Stata has different add-on packages such as latent class analysis, endogeneity, Spatial AR models, markdown, nonlinear multi-level models, finite mixture models, threshold regression etc.
2. SPSS enables the data to be summarized, displayed and gives production-ready analysis that can be exported to different types of document such as Excel, PDF etc., whereas Stata combines endogenous covariates, sample selection and endogenous treatment models for continuous and positive outcomes.
3. SPSS has advanced features such as random effects with solution results, robust and standard error handling, profile plots with error bars, whereas Stata discovers and understands the unobserved data groups on the basis of Latent Class Analysis (LCA) which is a feature of Stata.
4. SPSS compute statistics and standard data errors from complex data sample designs and analyses data on multi-stage designs, whereas Stata allows creating web pages, texts, regressions, results, reports, graphs, etc., which automatically reflects on a web page created.
5. SPSS latest version executes new Bayesian Statistics functions containing regression, t-tests and ANOVA, which is becoming more popular that circumvents a lot of misunderstanding created by standard statistical analysis, whereas Stata has mixed logit models that provide advanced choice modelling, which makes dozens of choices every day to introduce random effects into choice modelling which results in relaxation of assumption and increase in flexibility.
6.SPSS can quickly create modern charts attractively. Their editing in Microsoft Office tools, which are not easier normally in the native methods, the chart builder in SPSS can make these things more easier by creating publication standard charts. In contrast, Stata has Finite mixture models that provide continuously, count, binary, categorical, censored, ordinal and truncated outcomes customized with estimators and different combinations.
7. SPSS provides edit, write and format syntaxes with editor shortcut tools with a simple keyboard shortcut to join duplicate lines, delete lines and new lines, to remove empty lines, to move lines up and down and to trim trailing or leading spaces effectively, whereas Stata has Spatial autoregressive models that have observational units called spatial units in the areas of geographical research.
8. SPSS has SPSS Analytic Server, SPSS Modeler, SPSS Statistics and different variable types such as String and Numeric and has different variable formats, whereas Stata has different word documents to be created to automate the reports and generate results and graphs in tabular and text formats.
9. SPSS can perform Simple Statistical comparison tests, and the appropriate test has to be chosen as per the requirement in order to get the desired outcome, whereas Stata has a multi-level regression for interval measured outcomes which can be recorded into groupings as people’s weights and insect counts, grade point averages and thousands of other measures.
10. SPSS provides measurement levels in a classical approach using the parameters such as Nominal variable, Ordinal variable and internal variable and ratio variable, which are called Metric variables, whereas Stata can perform powerful linear regression models to find out the effective size, sample size, and power.
SPSS vs Stata Comparison Table
Below are the lists of points, describe the comparisons between SPSS vs Stata.
| BASIS FOR
COMPARISON |
SPSS | Stata |
| Complexity | SPSS can be used to model very complex data | Stata cannot be suitable for complex analysis |
| Analysis | SPSS can be used to perform multi-variant analysis procedures for large amounts of data | Stata provides normal analysis procedures. |
| Applications | SPSS is used in medical and social sciences areas | Stata is mostly used in econometrics |
| Benefits | SPSS can directly generate the outputs into reports. | Stata has a command line and documentation feature, which is highly useful. |
| Utility | SPSS is mainly used for complex data management like familiar excel spreadsheet | Stata is useful in cutting-edge research and ideal for developers or researchers. |
| Statistical Analysis | SPSS is a bit stronger in this area | Stata is relatively weak in this area |
| Development | SPSS is used to improve the agile development life cycle. | Stata is used for large-scale applications development. |
Conclusion
The main advantages of SPSS and Stata are that both are statistical analysis software tools that are used to manage or operate the data sets. SPSS can be chosen in the area of complex data analysis, whereas Stata can be used for cutting-edge research areas or in the research industry. Both tools are highly useful and have individual benefits in the different areas of requirement.
In terms of large and complex data analysis, SPSS can be considered, and Stata can be preferred and recommended to get high productivity and outputs in generating data reports.
Recommended Articles
This has been a guide to Differences Between SPSS vs Stata. Here we have covered their meaning, head to head comparison, key differences, along with infographics and a comparison table. You may also look at the following articles to learn more –

