What is the Stackelberg Model?
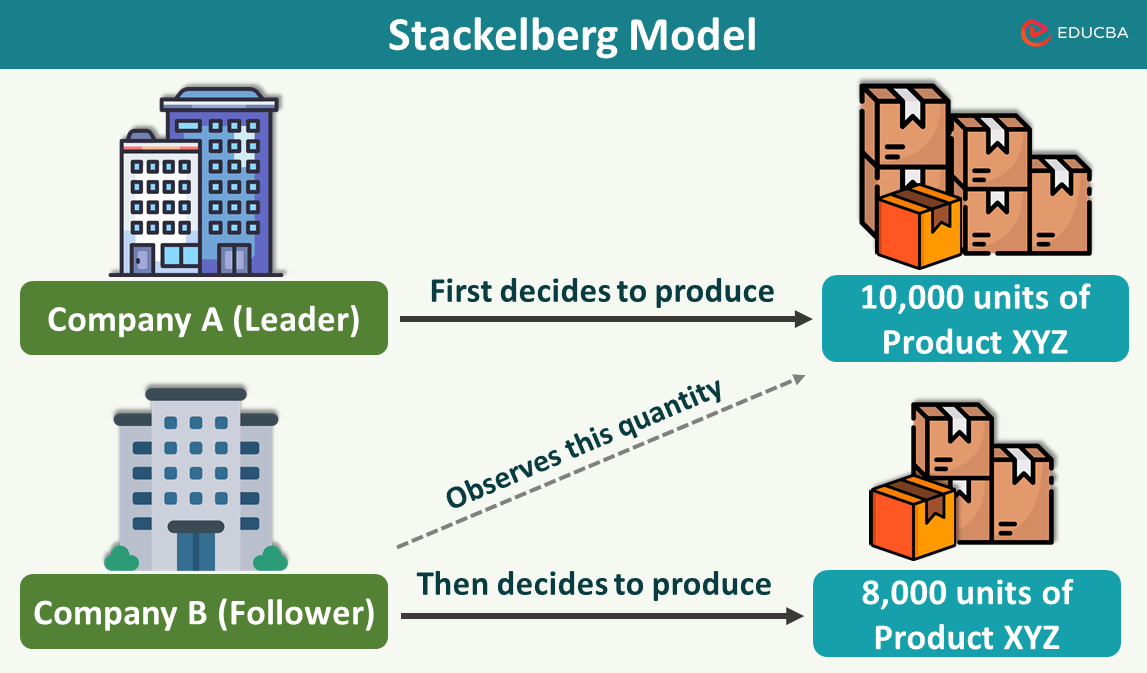
In the Stackelberg model, a single company assumes the role of the “leader” and determines the quantity of the product to produce. Then, other companies, referred to as “followers”, adjust their production levels based on the leader’s decisions. This model is particularly applicable in oligopolistic markets, where a small number of firms dominate.
While discussing the Stackelberg Model, you may encounter terms such as the “Stackelberg model of oligopoly” and the “Stackelberg model of duopoly“. The primary difference between these two is the number of firms involved. The oligopoly version usually involves more than two firms competing in the market. In contrast, the duopoly version has only two companies competing. As a result, in the oligopoly version, the leader company holds more power and can influence multiple follower companies. In the duopoly version, the leader can impact only one follower company.
Let’s take the example of two companies, A and B. As per the Stackelberg Model of duopoly, both firms will exhibit certain actions as follows:
- Firm A will be the first to set the product quantity.
- Firm B will decide its product quantity based on Firm A’s quantity.
- Both firms will sell their products in the market, and consumers will choose the product they want to buy.
- This cycle will continue, i.e., Firm A will lead and set the product quantity while Firm B will follow it.
Heinrich von Stackelberg, the German economist, presented the Stackelberg Model in 1934 in his work “Market Structure and Equilibrium”; hence the model is named after him. This model is different from other models like Cournot or Bertrand, where each company makes decisions on their own.
What is Stackelberg Model Game Theory?
The Stackelberg model game theory applies to various industries: manufacturing, finance, telecom, energy, technology, etc.
For example, let’s consider the energy industry. If two companies manufacture solar panels, one company will be the leader and decide how many panels to make. The other company will then decide whether to make the same amount of solar panels or try something different. Thus, the follower company decides how many solar panels to produce based on what the leader does.
How Does Backward Induction Work in Stackelberg Game Theory?
Using a detailed version of the above example, let’s understand the workings of backward induction in Stackelberg’s Game theory.
#1: Company A (leader) decides on the quantity.
In the solar panel industry, think of Company A as the leader. As per the first mover advantage of the Stackelberg model, it decides to make 10,000 high-quality solar panels.
#2: Company B (follower) responds to leaders’ decisions.
Now, Company B is a follower. After seeing what Company A is doing, it decides to make 8,000 solar panels. Company B aims to capture a substantial market share without directly competing with Company A’s production.
#3: Company A anticipates and analyzes Company B’s move.
Here’s where it gets interesting. Company A predicts what Company B will do (how many solar panels they will produce) even before Company A decides its own production quantity. Essentially, Company A looks at what Company B might do in advance. Company A also thinks about how it will affect its market share and overall profitability. It checks if this decision fits its goal of staying strong in the market or getting even stronger.
Based on this analysis, Company A decides to make 10,000 solar panels. As per the company, it is the best number to get a substantial market share and be the leader in making solar panels.
#4: Why did Company B Choose 8,000 Units?
Company B decides to make 8,000 units after careful analysis. It wants to sell its solar panels at a good price and attract customers’ attention. Importantly, it wants to achieve this without directly competing with Company A, as its goal is to maintain profitability without getting into a price war.
#5: Market Outcome
So, in the end, the solar panel market finds an equilibrium. Company A makes 10,000 units, and Company B makes 8,000 units. This equilibrium enables both companies to capture their targeted market shares without being too aggressive with pricing.
Assumptions
Here are the main assumptions of the Stackelberg model:
| Key Assumption | Explanation |
| Limited firms with market power: | Two major firms in the Stackelberg duopoly can influence prices with their production choices. |
| Uniform products: | All firms offer identical goods, removing product distinctions for consumers. |
| Quantity-based competition: | Firms compete by choosing production quantities and looking for a larger market share. |
| Sequential decision-making: | Decision-making unfolds in two periods, with the leader setting production first, followed by followers. |
| Market share vs. Profit dynamics: | Stackelberg leader firms may enjoy higher profit margins despite a smaller market share. |
Stackelberg Model Graph
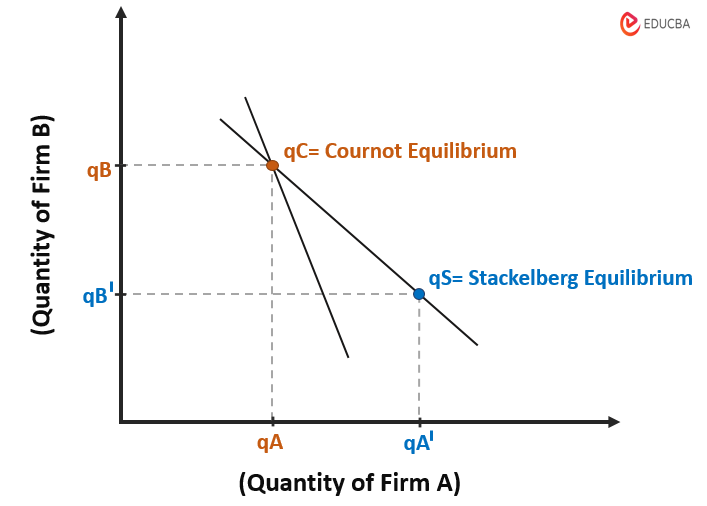
To understand the Stackelberg model diagram, consider Company A and Company B, which manufacture the same product. We can use the Cournot and Stackelberg models to analyze how these two companies will compete. Let’s first look at the graph for a simple scenario of the Cournot model.
Cournot Model
As per the Cournot model, both companies will individually choose their production levels (output) without considering each other’s choices. Let’s consider their output as qA and qB, respectively. If we want to represent this on the graph, we will show Company A’s (leader) output on the X-axis and Company B’s (follower) on the Y-axis. The Cournot equilibrium (qC) is where the quantities qA and qB intersect.
Stackelberg Model
Company A is the leader in the Stackelberg model and decides how much to produce first, say qA’. Company B then observes Company A’s choice and adjusts its production level to qB’.
Therefore, the Stackelberg equilibrium (qS) is where the quantities qA’ and qB’ intersect.
Comparison:
In Stackelberg Model:
- Company A (leader) produces more (qA’) than it would in Cournot (qA).
- Company B (follower) produces less (qB’) than it would in Cournot (qB).
In Cournot Model:
- Company A (leader) produces less (qA) than it would in Stackelberg (qA’).
- Company B (follower) produces more (qB) than it would in Stackelberg (qB’).
Stackelberg Vs. Cournot
This table shows the differences between the Stackelberg and Cournot model:
| Aspect | Stackelberg | Cournot |
| Decision Making | Based on the leader-follower model. (One firm acts as a leader, setting output first, and others follow). |
Based on simultaneous decision-making. (All firms independently set their outputs simultaneously). |
| Common in | Industries with clear market leaders. | Industries with homogeneous (similar) products. |
| Strategy | Quantity competition (Firms compete by setting output levels). |
Price leadership (The leader sets the price, and followers adjust accordingly). |
| Objective | Leader maximizes profit, and followers react. | All firms maximize individual profit. |
| Collusion | Potential for Implicit Collusion. (It occurs when firms make decisions that lead to higher prices or lower output). | Limited Implicit Collusion potential. |
Final Thoughts
Businesses need to study the market and gather accurate information to use the Stackelberg model effectively. They also need to understand their own strengths and weaknesses. In this way, businesses can position themselves strategically in competitive markets and gain an edge over their rivals.


