Updated March 31, 2023

Introduction to Statsmodels Linear Regression
Linear regression statsmodel is the model that helps us to predict and is used for fitting up the scenario where one parameter is directly dependent on the other parameter. Here, we have one variable that is dependent and the other one which is independent. Depending on the change in the value of the independent parameter, we need to predict the change in the dependent variable.
There are various ways in which we can fit the model by using the linear regression methods. In this article, we will have a general look at the overview of the linear regression in statsmodels, parameters used in them, the method to use the linear regression of statsmodel, have a look at the simple and multiple linear regression models, and also understand its implementation along with the help of an example. Finally, we will conclude our statement.
Statsmodels Linear Regression overviews
Linear regression is the models of the statsmodel that work along with the independent and errors that are distributed in an identical manner. These errors are generated taking into consideration the autocorrelation and also heteroscedasticity. The linear regression model comes with the support to use the generalized feasible least-squares along with the AR (p) that are nothing but autocorrelated errors, generalized Least Squares, Weighted Least Squares, and also the Ordinary Least Squares. The commands and the parameters of each one of them differ with respect to their usage.
The simple example of the linear regression can be represented by using the following equation that also forms the equation of the line on a graph –
B = p + q * A
Where B and A are the variables. B is the dependent variable whose value changes with respect to change the value of A. A is the independent variable and is the input value that we pass to our regression model. B is also called the value or output whose value is to be predicted or estimated. The q is the slope of the line of regression which represents the effect that A has over the value of B. p is the constant value that also represents the y-intercept that is the point where line of regression touches the Y-axis.
Statsmodels Linear Regression Parameters
The parameters involved in the description of implementing the linear regression are as specified below –
- Cholsimgainv – It is the array made of n* n dimensional triangular matrix that satisfies some constraints.
- Df_model – It is the float data type value that represents the degree of freedom of the model and the value is exactly the same as p-1. Here, p stands for the regressors count. Whenever we calculate the degree of freedom here, we do not consider the intercept here.
- Pinv_wexog – It is an array that has the dimensions of p * n which is Moore and Penrose pseudo-inverse matrix.
- Df_resid – It is a float value that corresponds to the degree of the freedom that s residual in nature and the value of the parameter is equal to n-p where p is the count of parameters that are passed while n is the count of observations. Here the intercept is the parameter that counts the freedom degree.
- Nobs – this parameter represents the number of observations and usually denoted by n.
- Llf – It is a float value that represents the likelihood function corresponding to the fitted model.
- Sigma – It is an array having dimensions of n*n and represents a covariance matrix with an error term.
- Normalized cov params – It is an array od p* p dimensions having the normalized covariance values.
- Sigma – This is an array of n * n dimensions and a covariance matrix that contains the error terms along with it.
- Wendog – It is the variable that is the whitened response and is of array data type.
- Wexog – It is an array and consists of the whitened design matrix.
How to Use statsmodels linear regression?
There are four available classes of the properties of the regression model that will help us to use the statsmodel linear regression. The classes are as listed below –
- OLS – Ordinary Least Square
- WLS – Weighted Least Square
- GLS – Generalized Least Square
- GLSAR – Feasible generalized Least Square along with the errors that are auto correlated.
We can make use of all the above-mentioned regression models in the same way following the same structure and same methodologies. Other than rolling WLS, recursive LS ad rolling OLS, the other classes of regression have the superclass of GLS.
Simple linear regression
When only one independent variable is there that’s varying in its value and we want to predict the value of one dependent variable that depends on the independent variable then the implementation of this scenario’s situation is called as Simple Linear Regression.
Multiple linear regression
When multiple independent variables are there that’s varying in their value and we want to predict the value of one dependent variable that depends on all the independent variables then the implementation of this scenario’s situation is called Multiple Linear Regression.
statsmodels linear regression Examples
After you have learned the basics of using the statsmodel, now it’s time to turn to a more sophisticated part where we will implement the linear regression in the source data with the help of the statsmodel package. We will follow the same steps mentioned in the above example with one additional part for the OLS model. Let us directly jump to code and then try to understand it –
// importing the necessary packages

import numpy as educbaSampleNumpy

import stateducbaSampleStatsodels.api as educbaSampleStats

// Loading the source data set

educba_data = educbaSampleStats.datasets.spector.load()

// Adding constants to the data file

educba_data.exog = educbaSampleStats.add_constant(educba_data.exog, prepend=False)

//Fitting the model which is in OLS

educbaModel = educbaSampleStats.OLS(educba_data.endog, educba_data.exog)

res = educbaModel.fit()

// Summarize the statistical results and printing the same on console

print(res.summary())
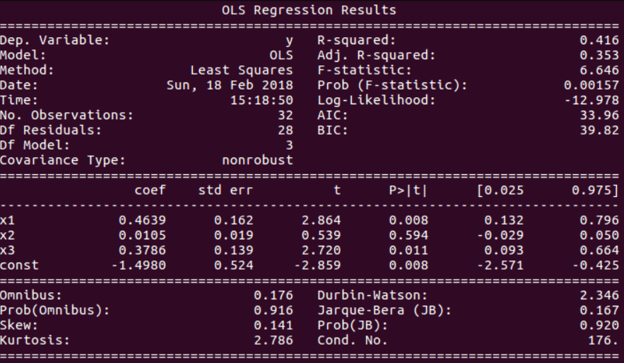
We can easily read the details of the result from the output. Execution of above code gives the following output –
Conclusion
Statsmodel Linear regression model helps to predict or estimate the values of the dependent variables as and when there is a change in the independent quantities.
Recommended Articles
This is a guide to Statsmodels Linear Regression. Here we discuss the Introduction, overviews, parameters, How to use statsmodels linear regression, and Examples. You may also have a look at the following articles to learn more –

