Updated July 26, 2023
Definition of Stock Turnover Ratio
The term “stock turnover ratio” refers to the measure of how well a company is able to manage its stock inventory to generate sales during a specific period of time.
In other words, it helps in assessing how quickly a company is able to sell off its inventory. Like most other turnover ratios, a higher STR is seen as positive because this indicates that the stock inventory is sold relatively quickly before they have a chance to deteriorate. It is advisable to calculate this ratio over a specific period of time rather than using any instantaneous financial information.
Formula
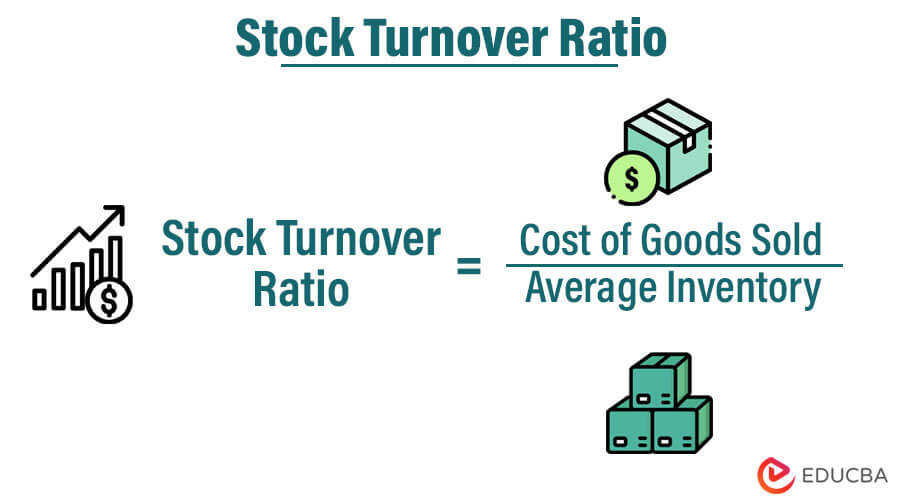
The formula for a stock turnover ratio can be derived by dividing the cost of goods sold for a specific period of time by the average stock inventory holding across the period. Mathematically, it is represented as,
Stock Turnover Ratio = Cost of Goods Sold / Average Inventory.
The manufacturing or production process directly assigns all the costs primarily attributed to it, forming the aggregate cost of goods sold. It includes the direct labor costs and the cost of raw materials. The cost of goods sold is also known as the cost of sales. The average inventory is the average of the stock inventory at the beginning of the year and at the end of the year.
Examples of Stock Turnover Ratio (With Excel Template)
Let’s take an example to understand the calculation in a better manner.
Example – #1
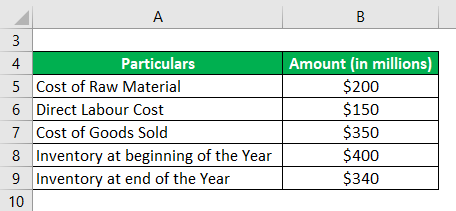
Let us take the example of CBM Ltd to illustrate the concept of the stock turnover ratio. As per the annual report released by the company, the following financial information is available:
Solution:
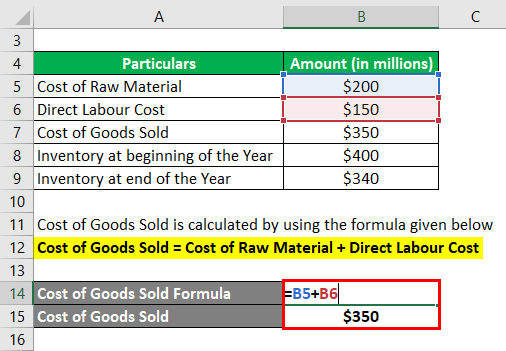
The formula for calculating the Cost of Goods Sold is as follows:
Cost of Goods Sold = Cost of Raw Material + Direct Labour Cost
- Cost of Goods Sold = $200 million + $150 million
- Cost of Goods Sold = $350 million
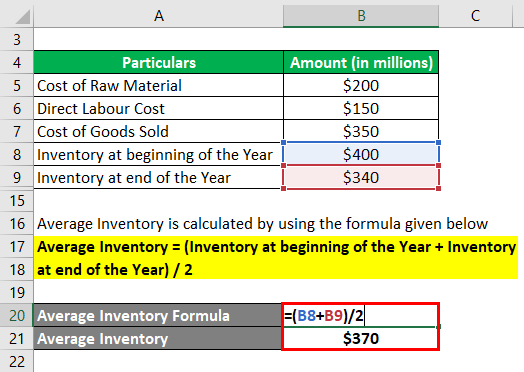
Average Inventory is calculated by using the formula given below
Average Inventory = (Inventory at the beginning of the Year + Inventory at the end of the Year) / 2
- Average Inventory = ($400 million + $340 million) / 2
- Average Inventory = $370 million
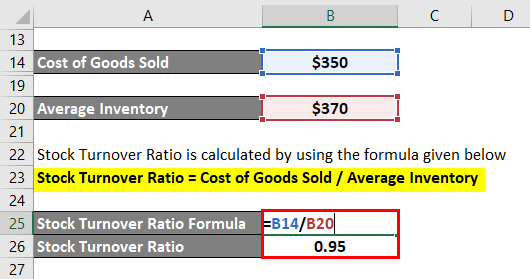
The formula for calculating the stock turnover ratio is as follows:
Stock Turnover Ratio = Cost of Goods Sold / Average Inventory
- STR = $350 million / $370 million
- STR = 0.95
Therefore, the company is able to sell off almost its entire inventory during the year.
Example – #2
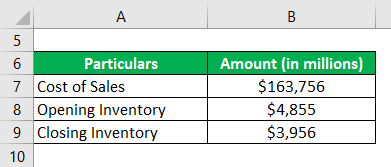
Let us take the example of Apple Inc. to calculate the stock turnover ratio for the year 2018. As per the company’s annual report for the year ending on September 29, 2018, the cost of sales during the year was $163,756 million, while the opening inventory and the closing inventory for the year stood at $4,855 million and $3,956 million, respectively. Calculate the STR for Apple Inc. for the year 2018 based on the given information.
Solution:
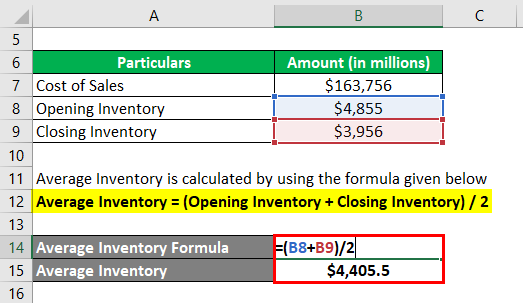
The formula for calculating the average inventory is as follows:
Average Inventory = (Opening Inventory + Closing Inventory) / 2
- Average Inventory = ($4,855 million + $3,956 million) / 2
- Average Inventory = $4,405.5 million
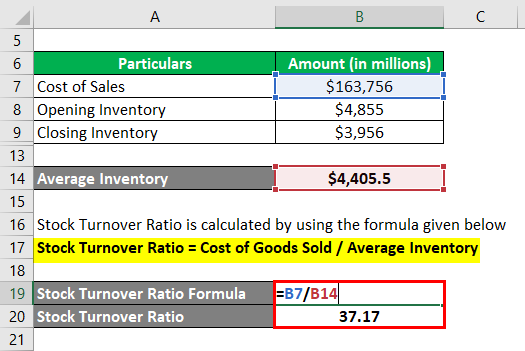
Stock Turnover Ratio = Cost of Goods Sold / Average Inventory
- STR = $163,756 million / $4,405.5 million
- STR = 37.17
Therefore, Apple Inc. was able to sell its inventory more than 37 times during 2018.
Source: Apple Annual Report
Example – #3
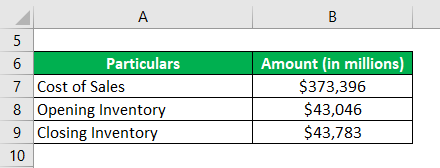
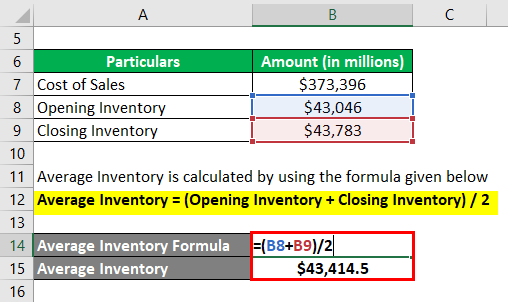
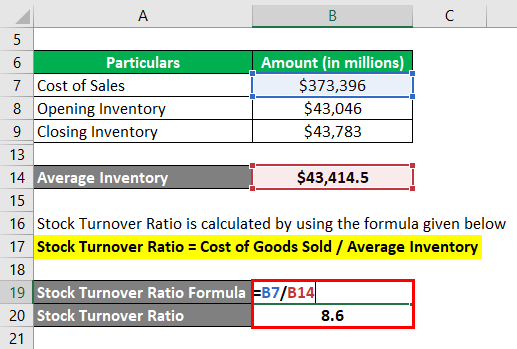
Let us take the example of Walmart Inc. for the calculation of the stock turnover ratio. As per the company’s annual report for the year ending on January 31, 2018, the cost of sales for the year was $373,396 million and the inventory at the beginning of the year and at the end of the year was $43,046 million and $43,783 million respectively. Calculate the STR for Walmart Inc. for the year by using the above information.
Solution:
The formula for calculating the average inventory is as follows:
Average Inventory = (Opening Inventory + Closing Inventory) / 2
- Average Inventory = ($43,046 million + $43,783 million) / 2
- Average Inventory = $43,414.5 million
The formula for calculating the stock turnover ratio is as follows:
Stock Turnover Ratio = Cost of Goods Sold / Average Inventory
- STR = $373,396 million / $43,414.5 million
- STR = 8.6
Therefore, Walmart Inc. managed to sell products worth more than 8 times its average inventory during the year.
Source: Walmart Annual Reports (Investor Relations)
Advantages and Disadvantages of Stock Turnover Ratio
Advantages
- It can be used to gauge the inventory management of a company among its peers.
Disadvantages
- Its calculation takes into account the average inventory, which may not be the true reflection of the actual inventory held during peak periods of the year (in the case of a seasonal business).
- The ratio does not differentiate between obsolete inventory and saleable inventory.
Conclusion
So, the stock turnover ratio is a tool that can be used to measure the inventory management capability of a company. It can be seen as the efficiency metric to see how well a company is able to use its stock inventory.
Recommended Articles
This is a guide to the Stock Turnover Ratio. Here we discuss how the Stock Turnover Ratio can be calculated by using the formula with examples and a downloadable Excel template. You can also go through our other suggested articles to learn more –
