Updated May 22, 2023
Introduction to Tableau Alerts
Tableau alerts are triggered when our data will reach a specified point that we have defined. Tableau alerts are very important for sending notification alerts we can send the notification by using email, or we can also send notification from the tableau site or by using connected slack. We can also set the data-driven alerts on dashboards and views. For the chart of time-based, we are using data filters that were relative, so people are automatically receiving the alert at the time new data appears. Alert in tableau is very important and useful.
Overview of Tableau Alerts
From version 10.3, Tableau has introduced alert features. Now from the dashboard of tableau, we can set up the mail notification which was automatic. To set the recipient’s web certain value will reach a specified threshold. We can use the tableau server to send the mail alerts of predefined users if we have met the specified threshold. The same is only possible when the view contains the numeric axis. To do the same on the dashboard, we need to click on the axis for the view that we are setting up the alert, then we need to click on the alert.
How to Create Dashboard Tableau Alerts?
Basically, a tableau server is used to send the alerts to recipients and users if suppose specified threshold is met. It is only possible when view contains the numeric axis.
Below steps shows how to create a dashboard tableau alert as follows:
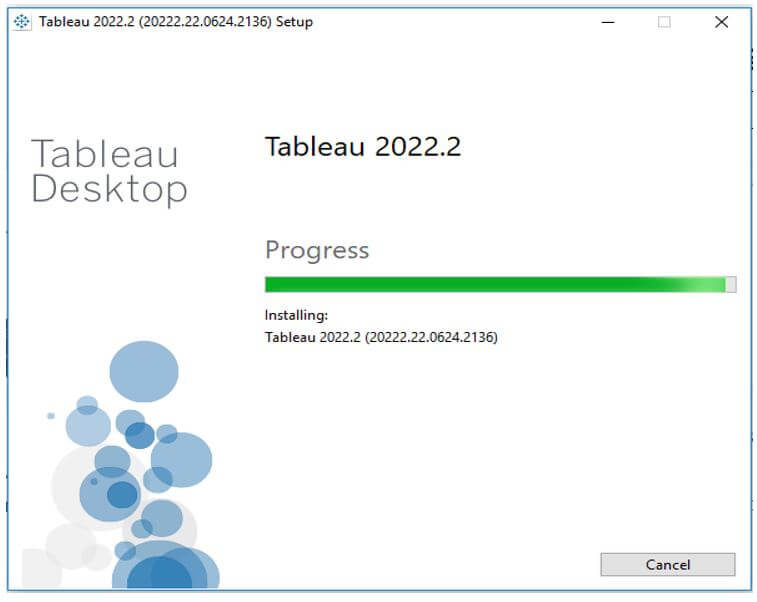
1. In first step we are downloading and installing the tableau in our system. We need to download the free trial version or we can buy the licensed product of the tableau server. After downloading the tableau, we are installing the same by using admin privileges.
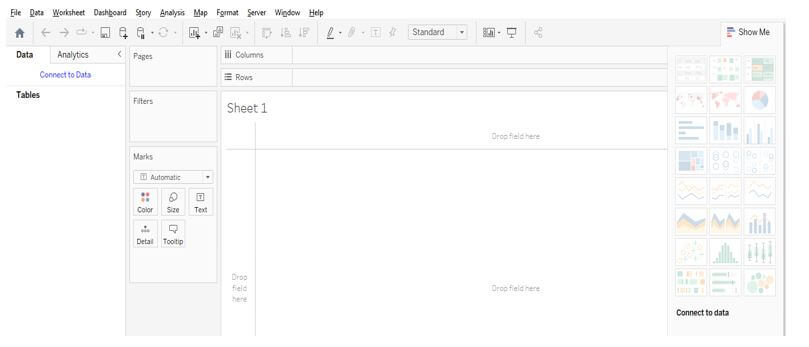
2. After installing the table we are opening the same; at the time of opening the server it will show that we need to activate the license by using the product key or we need to start the free trial. We are starting the tableau version by using a free trial as follows.
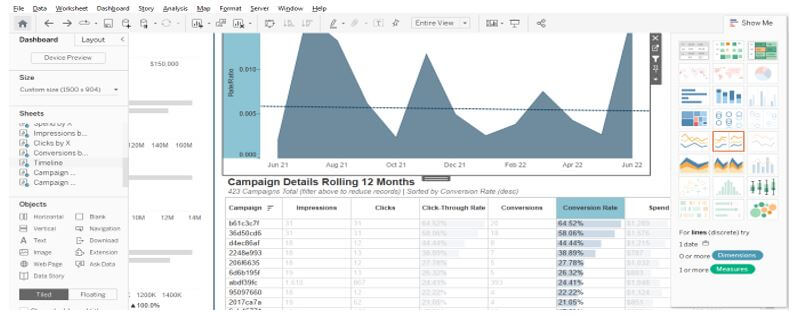
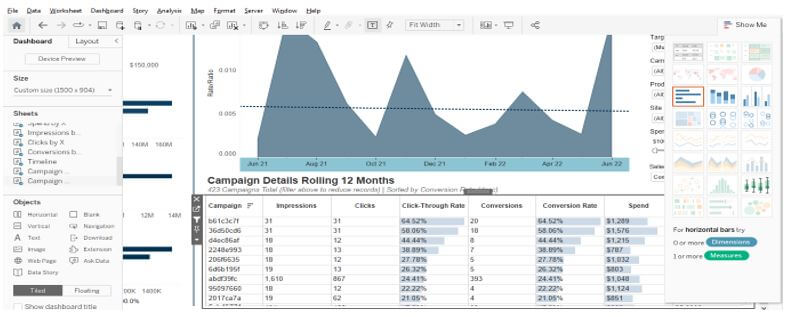
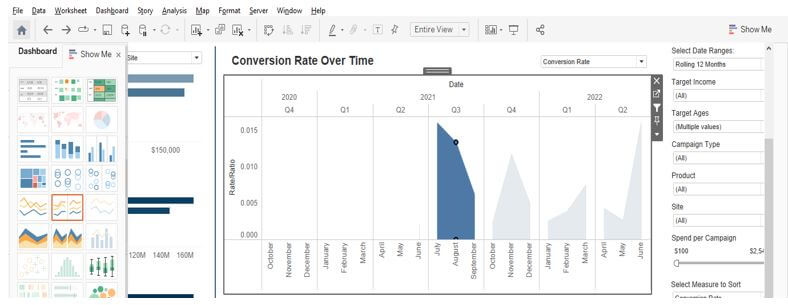
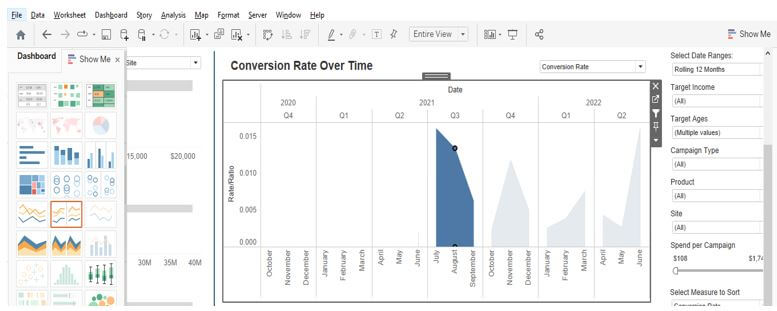
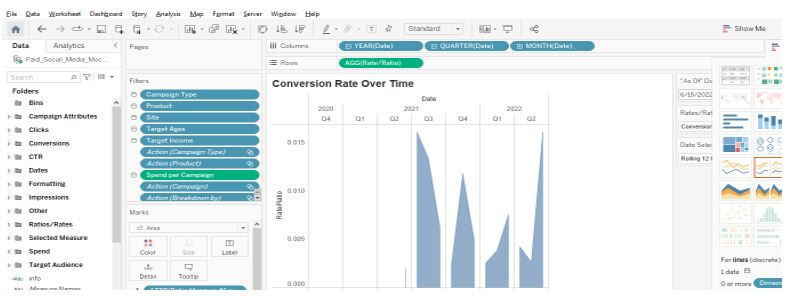
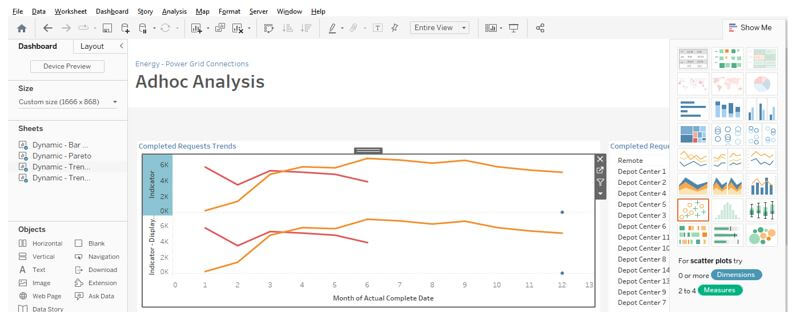
3. After opening the tableau server, we are creating the workbook and opening the same by using the tableau server. In the below example, we are defining the details of the campaign for the last 12 months. In the below example, we can see that the graph is automatically created at the time of loading the workbook into the tableau. The data is generating two axis graph, by using the axis we are setting up an alert in tableau.
4. After loading the workbook in this step, we are clicking on the axis on which we are setting up the alert. We are setting the alert as per the axis. We are setting up the alert on the Y axis of the graph as follows.
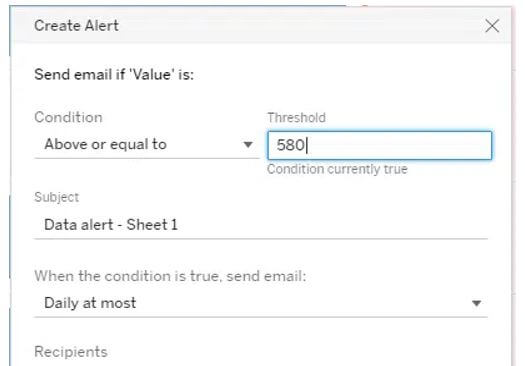
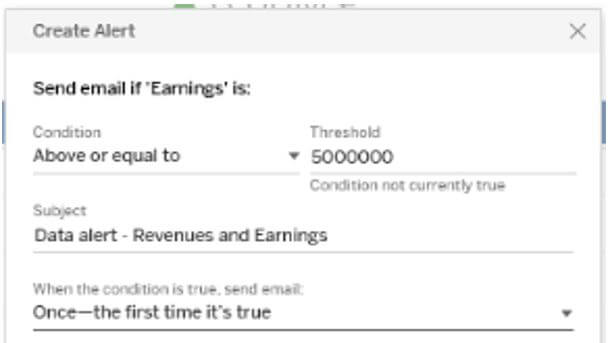
5. After clicking on the axis we need to click on the alert symbol. After clicking on the alert symbol, it will open below the window. In the below window we can see that we are setting the alert based on the condition; we are defining the threshold as 580 if suppose value is equal to or beyond that then it will trigger mail to the recipient which we are adding. Also, we need to give the name to the datasheet. We can also specify the recipient to which we are sending an email alert. In the below example, we have also specified the frequency of the alert. After clicking on “create alert” tab it will create the alert.
How do I Set Color Tableau Alerts?
The benefit of data visualization is arming the user’s ability to spot anomalies. By using color, this tool makes this process faster. Tableau will allow the user to assign the thresholds at the time color should appear, or it will change.
Below example shows how we set the color tableau alerts as follows:
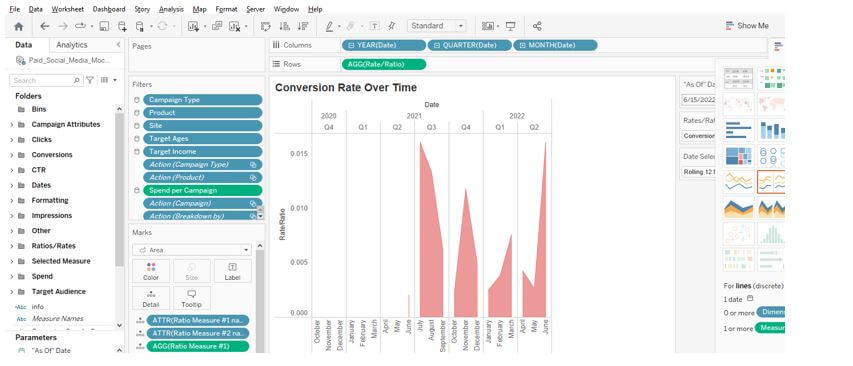
1. In the first step, we are opening the graph on which we are setting up the color alert. In the below example, we are using the graph of conversion rate as follows.
2. After opening the graph now we are clicking on the bar for which we are changing the color as follows.
3. After choosing the bar now, we are clicking on the edit button, and it will be opening the page in edit mode.
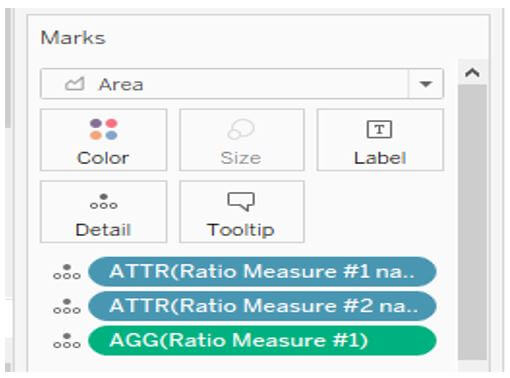
4. After opening graph in edit mode, we need to click on color tab to select the specified color for our graph as follows.
5. In the below step, we are changing the color of the alert which we have defined; we can choose any color from the specified list as follows.
Tableau Alerts Data
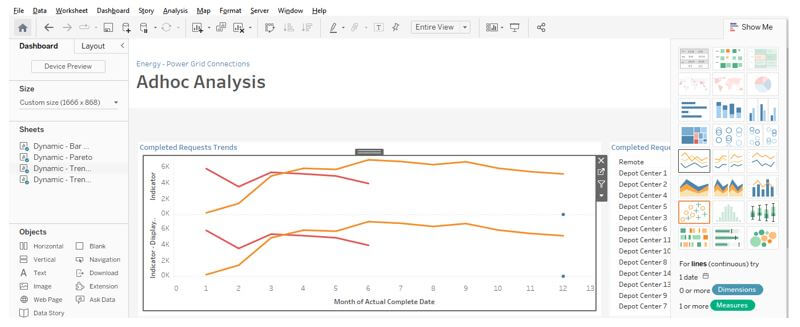
To set an alert by using data, we are using the service requests data. Below is the chart of tableau alert data as follows.
Below steps shows how we can use data to set the tableau alerts as follows:
1. In the first step, we are opening the datasheet graph, which we define as follows.
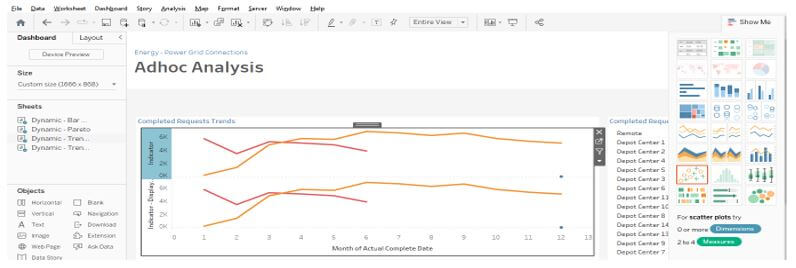
2. After opening the graph page now in this step we are clicking on axis on which we are setting up the data alert as follows.
3. In the below example, we are setting up the alert on x-axis, because we have selected the x-axis as follows.
4. After selecting the axis in this step we are creating the alert as per data we have given as follows.
Conclusion
We can use the tableau server to send mail alerts to predefined users if we have met the specified threshold. Tableau alerts are very important for sending notification alerts we can send notifications by using email, or we can also send notifications from the tableau site or by using connected slack.
Recommended Articles
This is a guide to Tableau Alerts. Here we discuss the introduction and how to create dashboard tableau alerts? and data, respectively. You may also have a look at the following articles to learn more –

