Updated March 20, 2023

Introduction to Tableau Architecture
Before we begin to know about the architecture of tableau, we should get to know about Tableau. A tableau is a tool that is used for visualization. It is used for visually analyzing the data. A person can create an interactive sharable dashboard using Tableau and that dashboard can be used to depict trends, variations in data using graphs and charts. It is not open-source but a student version is available. The interesting part about it is it allows real-time data analysis. Tableau uses a multi-process, multi-threaded, multi-user system and can run on virtual as well as physical systems.
Architecture and Components
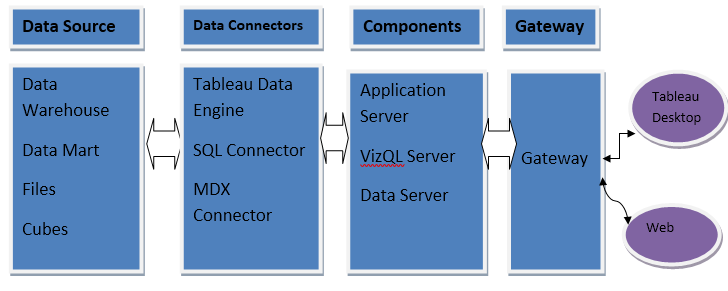
The below figure shows the architecture and components.
1. Data Source
Tableau can connect to and also blend the data from multiple data sources. It can connect to data sources remotely. Furthermore, it can connect to an Excel file, a web application or a database.
2. Data Connectors
Data Connectors consist of Tableau Engine and various other connectors as we can see from the above diagram.
- Tableau Data Engine: Data Engine stores the tableau data extract which is pooled from various data sources. Data Engine responses to any visualization that has been created using the tableau data extract. So, tableau data extract is itself a database. The job of the data engine to process the various request coming to the tableau data extract. The data engine gets its request from the VizQL Server which we will refer later. We can conclude that the user is not directly connecting to any database.
- ODBC/sql connector: It can extract both live as well as in-memory data depending on the requirement. A feature of the ODBC connector is it can connect to any databases without using their native connector.
- Live data: Tableau can provide live data by connecting to external data sources using the existing infrastructure of their databases by sending dynamic MDX and sql statements.
- In-memory data: We can also make a copy of the extracted data from external sources in the form of tableau data extracted from the file.
3. Tableau Server
Now, we move onto the tableau server and its components.
- Application server: It is a server process that executes everything but visualization in Tableau. It does content management, authentication processes in tableau. It is multi-server, multi-process, and multi-threaded.
- VizQL Server: It is the heart of Tableau’s process and the most important as it is what makes Tableau unique. Unlike the gateway is not lightweight and we can also say a bit memory hungry. It produces visualization content. It is everything that is not done by the application server. So once the request data comes to this server. It first converts the request into an SQL query and then sends the query directly to the data source using respective data source drivers. The requested data comes back to the VizQL server where it is processed and data is sent in the form of images that are then displayed to the front end. It is multi-server, multi-process, and multi-threaded.
- Data Server: It serves as a proxy for data sources. It is by using this proxy that tableau is able to connect to databases. One of its key features is that it provides metadata management for data sources.
4. Gateway
Gateway is a very much light weighted apache web server. So, whenever a client tries to for example login to the tableau server. The gateway, in this case, will forward the request to the application server for authentication purposes. So it is the gateway where we feed the request and it carries it to different processes depending on the type of request. At the end of your request processing, the gateway reassembles the HTML response and shows it on the client browser. If no external load balancing is present, the gateway will also load the balancing of some of the requests routed between distinct procedures. One important point to note is that gateway is a multi-server single process and multi-threaded which means we cannot have multiple instances of gateway running in them.
5. Clients
This is the User Interface from where we send the requests and all the visualizations can be viewed or edited from here.
- Tableau Desktop: It is an analytical tool that can help to create and view dashboards in Tableau Server using Tableau Desktop.
- Web: Just like mobile browsers many web browsers like Google Chrome, Internet Explorer, Safari support the Tableau Server and visualizations in the dashboard can be viewed and edited using these browsers.
Features of Tableau Architecture
Now let’s look at the various features of Tableau. Below certain salient features of Tableau are mentioned.
- We can use live data from external databases for our visualizations by directly connecting them.
- The visualizations can be viewed using different clients: Tableau Desktop, Mobile and Web.
- We can create interactive dashboards.
- It has a list of native data connectors.
- We can share dashboards using Tableau.
- We can create Mobile ready dashboards.
- Tableau server translates data queries into visualizations.
- We can use Tableau Public for data sharing.
- It has metadata management and security permissions at any level.
Conclusion
We can conclude this article by saying that it is a very versatile and powerful visualization tool and due to its architecture and features make it a very powerful and unique tool which is the reason that it is being widely considered as a tool to visualize and analyze data in most business organizations across all domains as it has the capacity to work with data of all shapes and sizes. While going through the article we can also state that it can be used by any non-programmer to get create visualizations based on his/her requirements and needs.
Recommended Articles
This has been a guide to Tableau Architecture. Here we have discuss its features, Architecture, and components of tableau. You can also go through our other suggested articles to learn more –

