Introduction to Tableau Group By
Group By the name itself define activity done by the visualization. Grouping of the similar or the different measures and dimensions. We can combine the groups of similar or related members in the tableau field. We can create a group for the categories or the countries. Suppose we have started doing visualization with sample superstore database, we can create a group for the dimensions like category, sub-category and measures like profit (average profit), etc. It will be used for correcting data errors and answering questions like what if. What if is nothing but the what-if group states.
Syntax
There is no formula like syntax present for the group in the visualization but there are steps to be performed. Got to dimension or measure field -> right click on the field->create->group
How does Group by done in Tableau?
- we have imported sample – superstore database into tableau.
- We have dragged the order table into the sheet.
We will create a group by dimension.
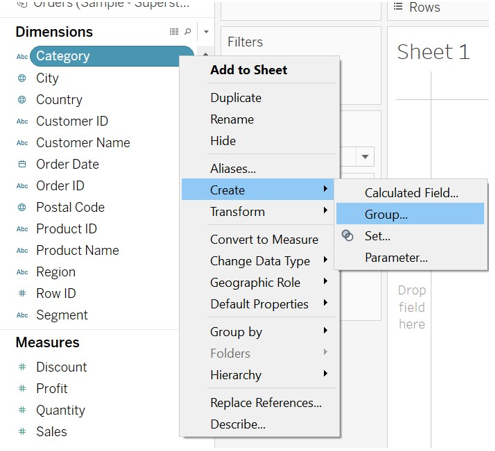
- Go to the category dimension ->right click->create a group
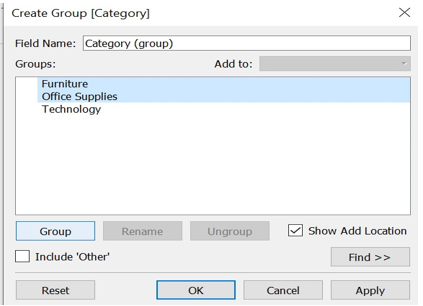
- Select the choices from the field category and click on the group. We have group Furniture and Office Supplies.
- Group has been created in the dimension field.
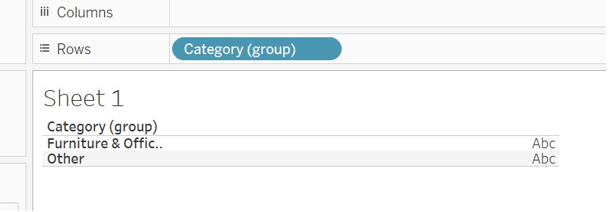
- We can add category (group) to the Filters and can see group values. We can see that Furniture and Office Supplier has been grouped.
Example of Tableau Group by
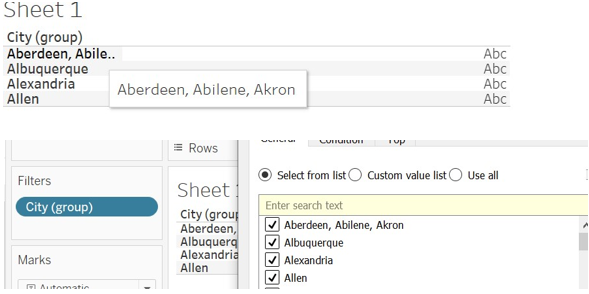
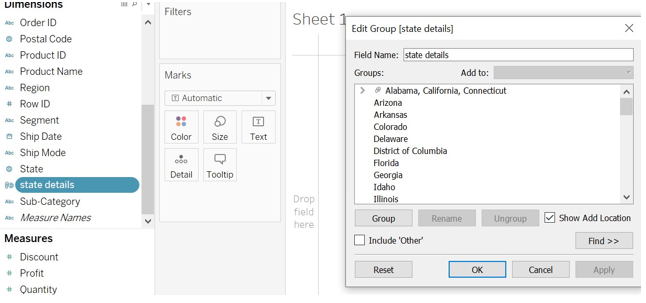
- We have again created a group for the city dimension. We have grouped Aberdeen, Abilene, Akron city and selected random cities. To see this data we need to drag the city(group) to the Filters.
- We can create a group for the dimension field also. The created group will be reflected in the Dimension field.
- We have created a group for the discount and selected only 0.1, 02 and 0.3 and the last 0.149 values as a discount.
We can create groups with remaining choices or items, and we can include this created groups while creating a new one or adding one or another. Including other groups will help us to highlight major and minor points of the data or to show differentiation of the result (group members).
Working of Tableau Group by
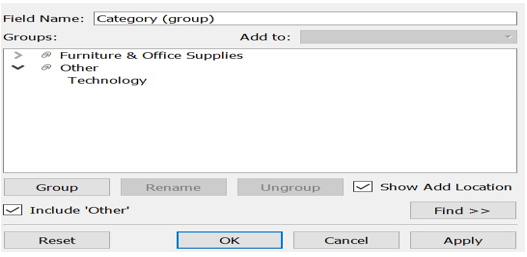
- Go to the category group->right click->edit group->mark include other
- We can observe in the below image, other which is nothing, but the office category has been added to the group (by using include other choices).
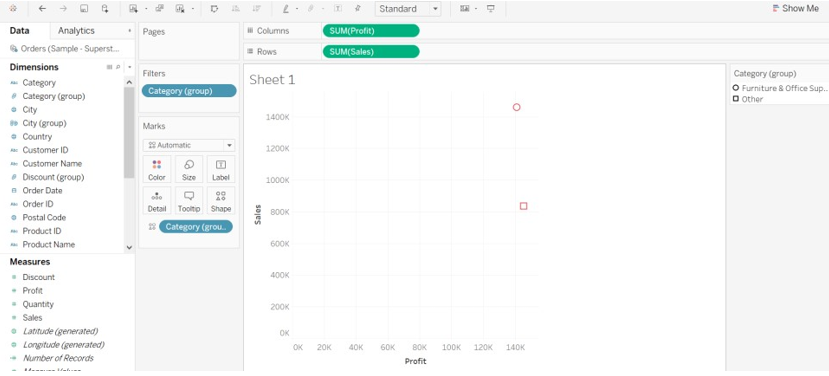
We are going to see profit and sales for the category group like how each measure has performed for the category dimension.
- Drag profit to column and sales to rows.
- Drag category group to the Filters.
- Select all option from the Filter window.
- For editing purpose change color of the category group (click on color->select color of your choice)
You can observe in the below image how data is displayed in the tableau group by the view.
We have the Edit option for the group by data. Editing option, we can use to change the group name as per our choice, add and remove other choices of the filed, create a new group. We need to use the edit group option always while making changes in the group.
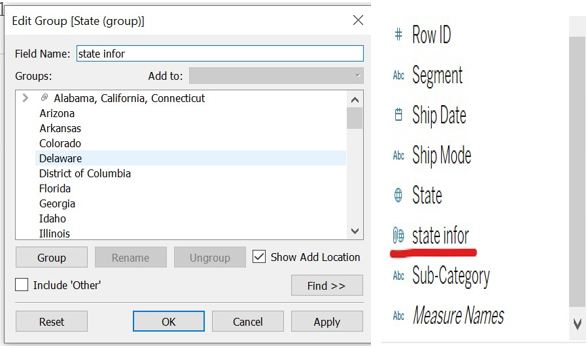
- We can rename the group as we want to frame it. We are going to perform these tasks for the state(group).
- Right-click on the state(group) -> window will option we can rename it. You can observe in the below image how renaming is affected.
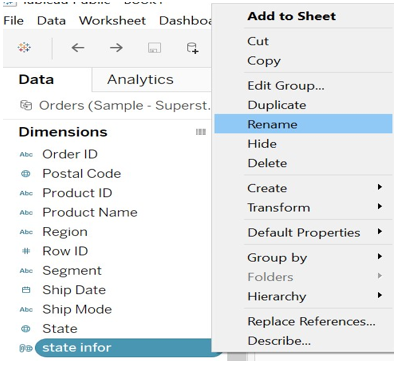
- Or we can rename the group in another way.
- Right click on the group -> click on rename option -> name it.
- We can observe in the below image the result of the renaming in another way.
- We can add members to the group or remove it through the edit group option.
- Go to the group you want to edit with.
- Right-click on the group -> edit group->click on the group icon
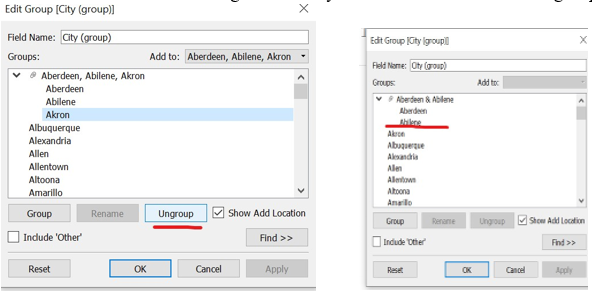
- The select member you don’t want to group with – > click on Ungroup.
You can observe in the below image Akron city has been removed from the group.
- For adding purpose follow the main step of adding a member to the group.
Select member -> click on Group option.
- We can color the group as per our wish, drag group to the color section.
Conclusion
We have understood what is the group by, how it should be done and what choices it offers and how this will help us to get more detailed of the data or comparison of the data. It is easy to do editing with the data such as color, rename, size or shape of the data. Grouping will help us to find out how data is increasing and decreasing in terms of performance. If we create a group by of the measure, then resulted group is reflected in the dimension field.
Recommended Articles
This is a guide to Tableau Group by. Here we discuss how does Group by done in Tableau along with the working and examples. You may also have a look at the following articles to learn more –
