Updated March 28, 2023

Introduction to Tableau Parameter Filter
The parameter is the dynamic value that we can change in the chart or bar graph. The parameter can be anything like text, range of values. Some visualization options are not available into a visualization for the data, with the help of parameter filter we can create values for better visualizations. We can create a parameter with field-based value but if field changes then parameter values do not change. Parameter keeps old values only. We can use a parameter with the filters or with the sets. As the parameter is a dynamic value, it changes the constant value in the calculation or reference lines. We can make parameters more dynamic with parameter actions. In this topic, we are going to learn about Tableau Parameter Filter.
Syntax
Filter ->TOP->By field->select default value or create new parameter.
How does the parameter filter done in Tableau?
Whatever parameter value we select or add in the parameter, the result is displayed to the user. We have to select a range of values like 10, 20 or any number till we want to fetch the result.
The result is changed dynamically due to the parameter.
Examples of Tableau Parameter Filter
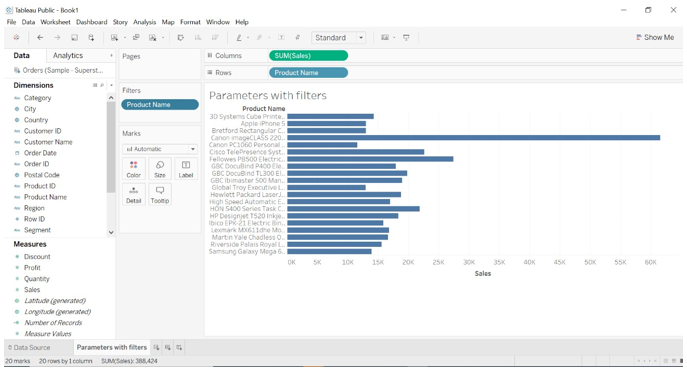
We are going to create a chart as per the top 20 sales as per the product name.
- Open Tableau public or desktop version.
- Connect to the sample superstore database and drag the order table to the data source sheet.
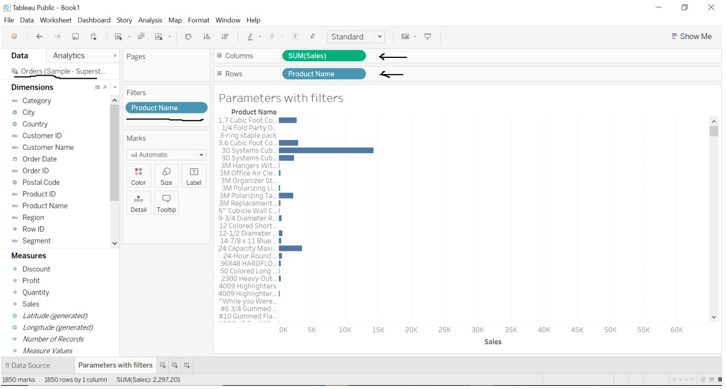
- Drag sales (measure) to columns and Product Name (dimension) to rows.
- Drag product name to filter editing option.
Before applying the parameter with filter
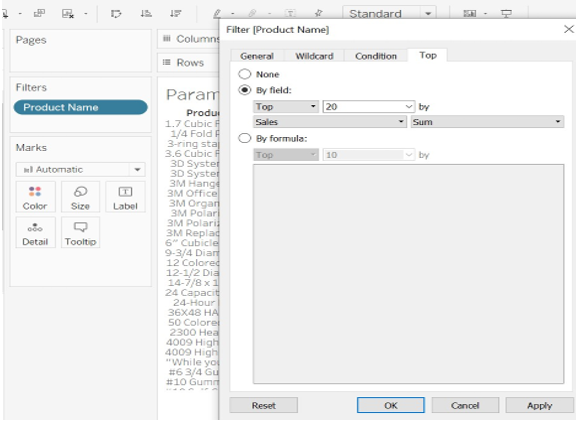
- Go to Product Name filter->Select TOP->Select->By Field->enter TOP value as 20.
- The default top value is 10, we can change values that is the reason it is called a dynamic parameter.
- Top 20 sale as per the product name will be displayed rather than whole data. We can observe in the previous image long list of data was available, now it is changed.
After applying parameter with filter (the parameter is selected as top 20 sales for product name)
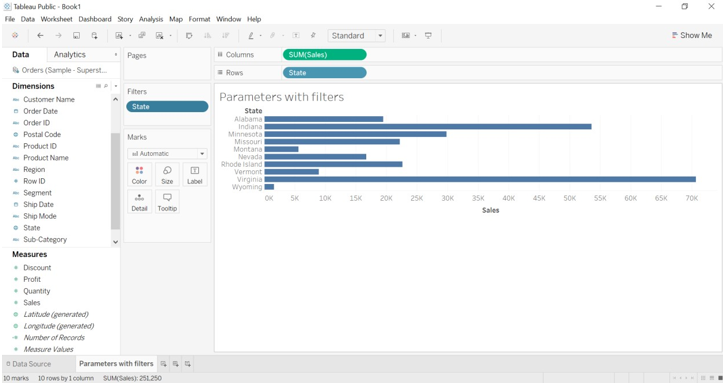
We are going to create a chart as per the top 10 sales as per the state.
- We have dragged the state dimension to rows and filter formatting options.
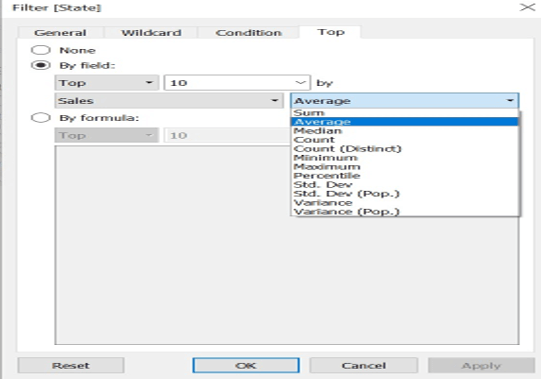
- Go to State ->click->select edit filter->Select TOP->Select->By Field->enter TOP value as 10.
- A select sum of the average value. We can select any calculation value we want from the drop-down menu of the parameter and get the requested data.
- We will get an average sale value for the top 10 states.
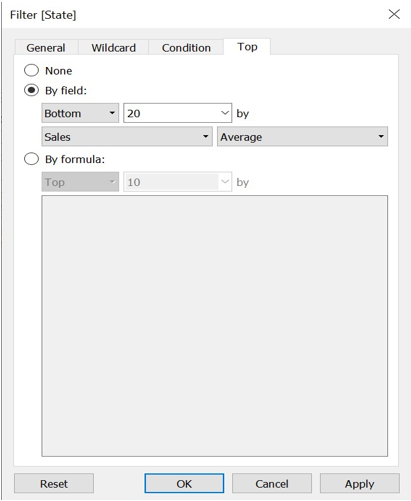
- we have worked with the TOP value as a parameter. We will work with the Bottom value of the parameter. We can retrieve the result from selecting the bottom value (descending order).
- Go to Top filter and select field as bottom
- Change the value to 20.
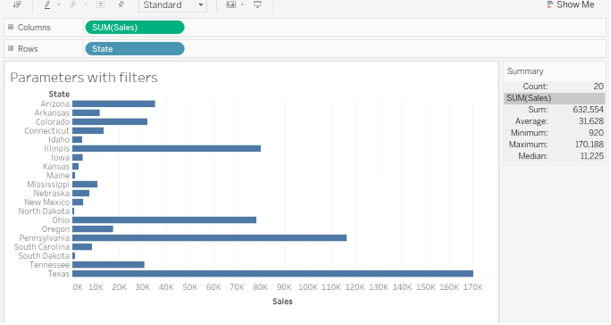
We are going to retrieve average sales for 20 states from the bottom.
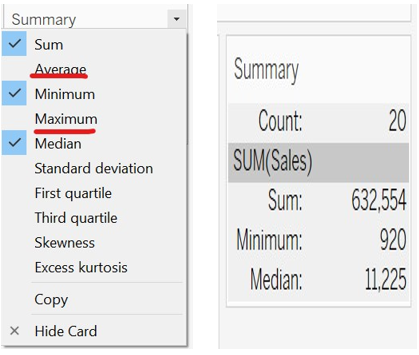
- We have got results with average sales from the bottom for 20 states. We can see the result in the summary details of the data.
- Click on the blank space-> new window will open->click on the summary.
We can observe in the summary count is shown as 20. The right data is displayed.
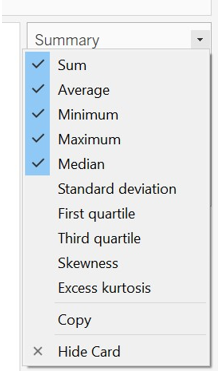
- We can edit the summary details like what to display on the screen. We don’t need to display all the parameters. We can click on any measure like Average or Minimum which we don’t want to see, and value will disappear from the summary window.
- We can see in the below image what the result will appear. Deselected Average and Maximum.
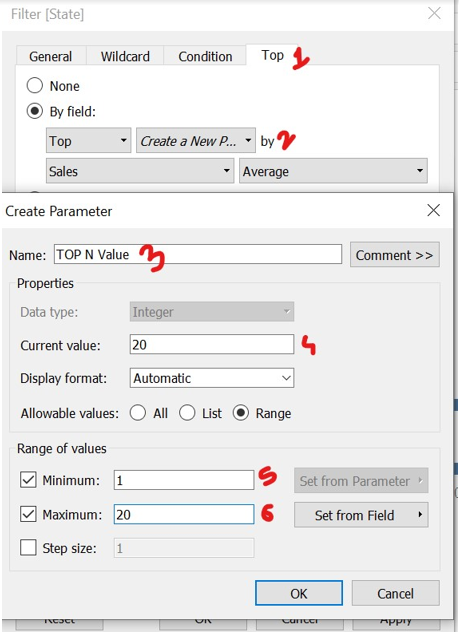
Till the time we have understood how to do it manually, but we don’t need to select and add value every time manually we can do it with creating a new parameter.
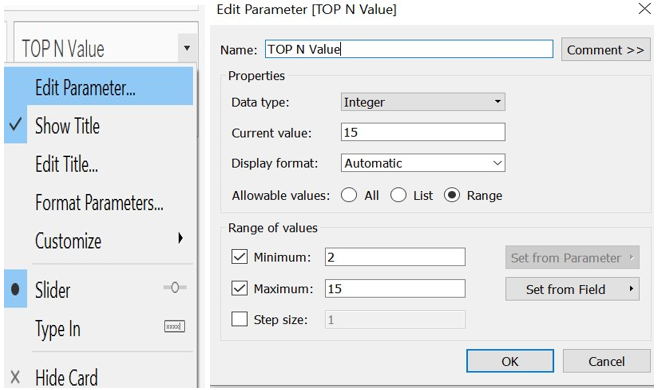
Go to Top option->select create new parameter->give parameter name->select minimum, maximum and current value.
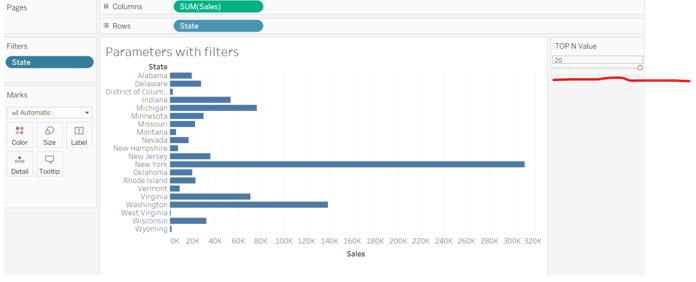
- We can fetch results automatically.
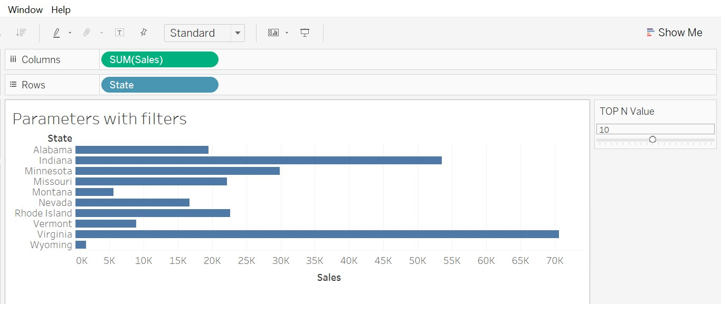
- We can select the value as 10 by moving the cursor on the parameter we have created.
We can change the value in the parameter filters as per our choice. Click on the edit parameter.
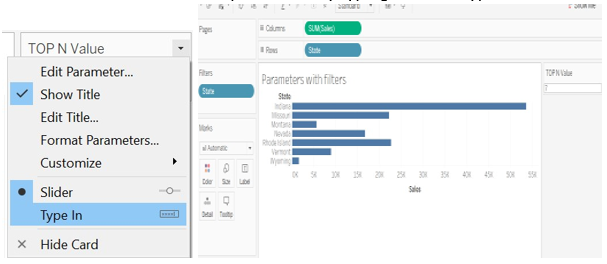
- Users can enter a value in the parameter by typing feature. Type in value as 7.
Parameters with sets
We can create a set for the group of values with parameter filters to highlight the data we want.
- We are going to create a parameter for the sales measure with a set of the subcategory dimension.
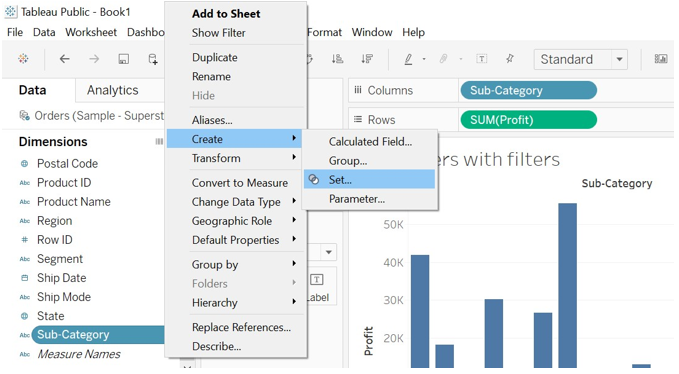
- Go to sub-category->click on it->select Create->Set
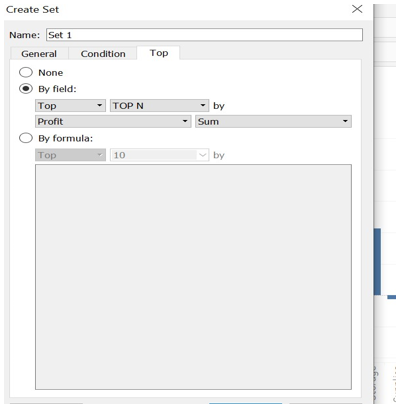
- Go to TOP->by field select TOP N->click on ok.
We are using the parameter as TOP N because we have created TOP N parameter for the sub-category.
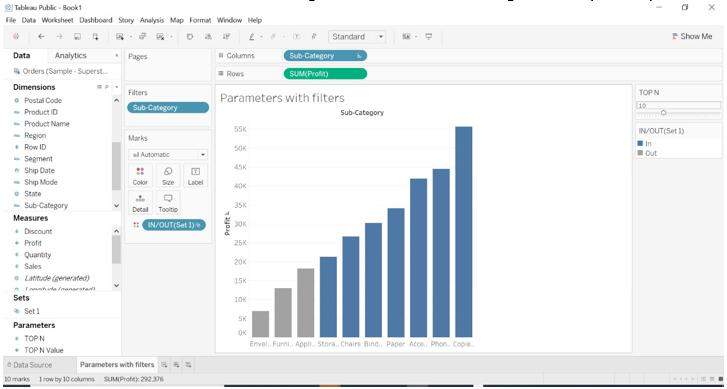
- Set 1 is created below the measure. Drag Set 1 to color. We have got sales by the top 10.
- We can change this value by changing the parameter value and the set will change.
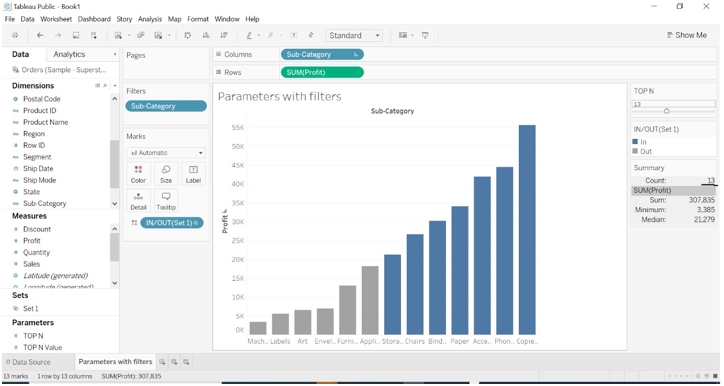
Have a look at the below image. The parameter value is set to 13 and sets changes.
Conclusion
We have learned about parameter filters and how to use it. We can use a parameter with filters and sets. We can drag parameter value automatically. We can have different editing and color choice options while using sets. We have advanced options available to make the parameter more dynamic. The parameter is the dynamic value.
Recommended Articles
This is a guide to Tableau Parameter Filter. Here we discuss How does the parameter filter done in Tableau along with the examples. You may also have a look at the following articles to learn more –
