Updated July 17, 2023
Definition of Tail Risk
Tail risk also known as fat tail risk is a form of risk related to assets or portfolios of assets. It occurs when there is a possibility of fluctuation in the investment and it is expected that the value of the investment will fluctuate from its mean point to three standard deviations.
Explanation
Usually, the financial market follows a normal distribution but with the introduction of tail risk, the idea that the distribution of returns is not normal but has fatter tails crosses the mind. A tail risk or fat tail risk is an event of a risk for the portfolios of assets. It occurs when there is a possibility of fluctuation in the investment from its mean point to three standard deviations. Although the probability of such events to occur is quite low but still, it can cause great negative consequences for the market as well as for the portfolios.
How Does It Work?
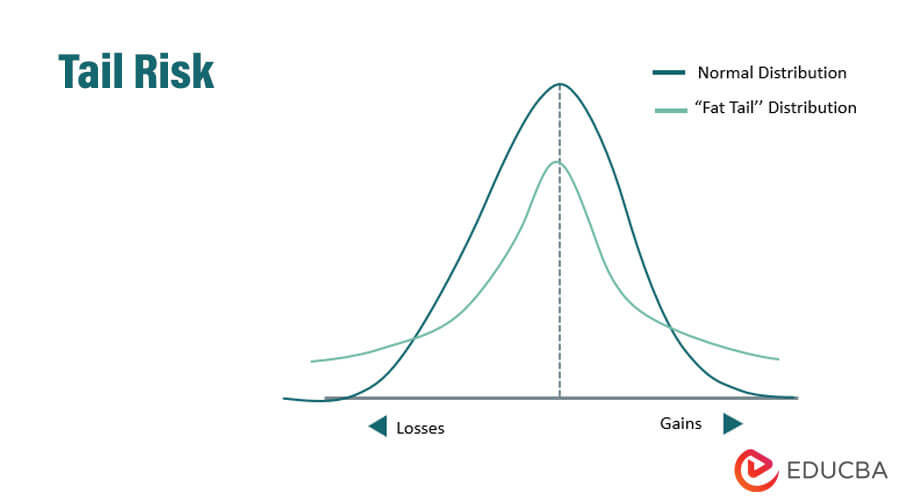
A tail risk occurs when there is a possibility of three standard deviations to move further than the mean point. Usually, in financial markets, it is believed that returns that are generated from the securities and portfolios have a normal distribution. Such distribution is also called bell-shaped distribution. But tail risk suggests that these distributions are not normal but has fatter tails, the left side of the tail represents the lowest return an investor can get on the investment while the right side of the tail represents the highest return an investor can get. It can also be named as left tail risk and right tail risk depending upon the sides; left tail risk shows negative returns while right tail risk shows positive returns of a portfolio.
Example of Tail Risk
A tail risk can be understood better by taking a real-life example. In 2007, the health of 30 public companies of the United States of America was contained in the Dow Index, these companies were also a part of the S&P 500 Index. The index showed great performance and went above the 24k mark in December 2017 and continued to show an upward movement since then.
In January 2018, the index which had been continuing to show an upward movement hit the mark of 26k and investors were expecting that this growth will continue to flourish but due to trade wars and economic slowdown, the whole market of the US suffered. It also created an impact on the Dow Index and it reached fall back to the 24k mark in October 2018. It was a massive fall for the market and the Dow index fell to 21k in December 2018. It was a 19℅ downward move in the year. The tail risk in the Dow Index was when it went below the 24k mark in October 2018, as the downfall from 26k to 24k was a behavioral movement but when it went below that, the condition got worse.
The ups and downs faced by the Dow index was a great example of tail risk.
Graphical Representation of Tail Risk
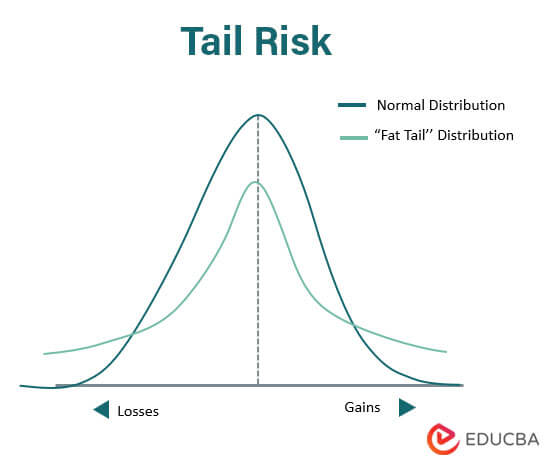
A tail risk can be better understood with the help of graphical representation. Here,
- The bluebell curve indicates the normal distribution that is generated from the securities or the portfolios.
- The green bell curve indicates the tail risk fluctuations that could happen in the investment from the mean point to the three normal deviations.
The left tail of the green curve shows how that much loss an investor can suffer while the right tail of the green curve shows how much the investor can gain on investments.
Uses of Tail Risk
Uses of tail risk are as follows:
- It shows investors all the possible risks that could happen which makes them able to gauge the risks.
- Tail risk enables investors to take quick and accurate decisions in the investment strategy.
- Tail risk is used to support hedging which results in better and increased cash flow in the market.
- Tail risk is used to get knowledge about the negative activity that could happen in the market.
Advantages
Some of the advantages are given below:
- Enhanced decision making: Tail risk enables the investor in measuring the unforeseen risks which enable the investor to take accurate decisions.
- Encouragement of hedging: Tail risk encourages hedging which results in the better and increased flow of funds in the market.
- Create awareness: Tail risk creates awareness about all the possible risks that could happen in the future which could create a great negative impact thus creating awareness.
Disadvantages
Some of the disadvantages are given below:
- Possibility of not occurring: There is a high possibility for the tail risk that it wouldn’t occur even onetime as there is a quite low chance of such occurring.
- The fear among the investors: Tail risk creates a sense of fear among the investors which can result in fewer investments and can create a negative outlook.
Conclusion
The possibility of losses that could happen shortly due to any unforeseen event is known as tail risk. It can be on both the sides of the curve as the right tail and the left tail, the right side indicates gains while the left side indicates losses. It is beneficial for the businesses and the investors as they can study tail risk which will help them to take accurate decisions for investment.
Recommended Articles
This is a guide to Tail Risk. Here we also discuss the definition and how does tail risk work? along with advantages and disadvantages. You may also have a look at the following articles to learn more –


