Updated February 28, 2023

Introduction to TensorFlow Debugging
In this article, we will try and understand what the different ways of debugging can be done in TensorFlow. Generally debugging is very useful for finding out the values getting flown down in the code and where exactly the code is breaking. All the languages present in the market provide inbuilt functionality for debugging. Similarly, in TensorFlow also provides different classes and packages with which we can identify the flow of the data in the algorithms and optimize the algorithm’s performance.
How Debugging Works in TensorFlow?
Now let’s see how the debugging works in TensorFlow.
The core program part where the debugging can be enabled in TensorFlow are:
- graph(though the use of this function we can build a computation graph)
- session(though the use of this function we can execute the graph)
there are in total 4 ways as shown below through which we can perform debugging in TensorFlow
1. Fetching and Printing Values for a Particular Tensor
This is the easiest to use step where we can add breakpoints and print out the values to get the required information
Advantage:
- It is very easy and quick to implement.
- And information can be fetched from anywhere we want.
Disadvantage:
- If we print any information at any point, then that will create a reference to that particular tensor which is not a good practice to keep
2. The tf.print function
This method can come handy while checking some output in runtime. It will just create a log for the particular line in the with the use of the session.run() method.
Advantage:
- This method is handy as it helps us to monitor the development of the values during the run time.
Disadvantage:
- Since this creates a log of the terminal data during the execution of the algorithm, it might fill up the screen with the logs that are not a good practice Afterall.
Before moving on towards the last two debugging steps
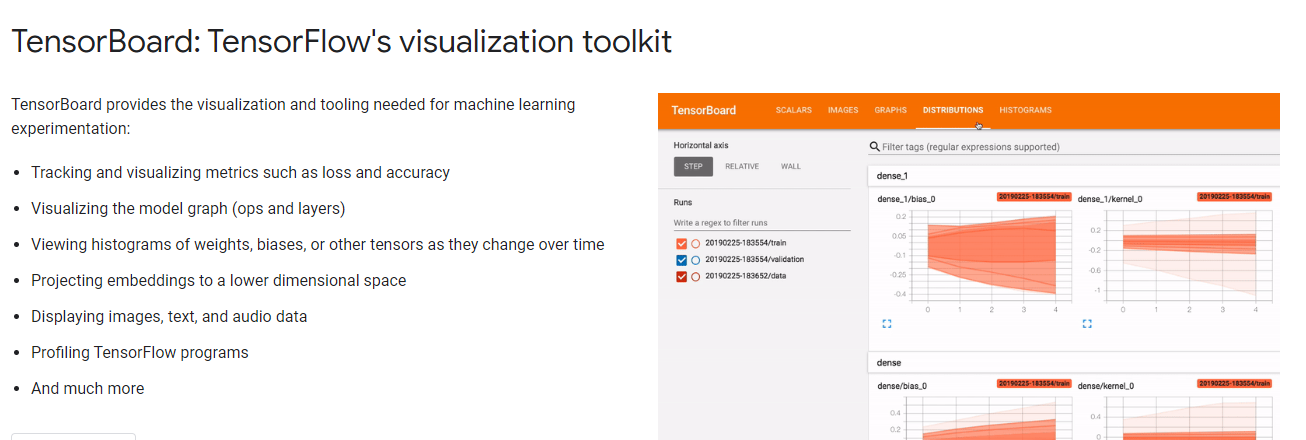
just want to discuss the tool which TensorFlow provides called Tensor Board. It’s a web UI for TensorFlow visualization developed by Google and runs locally in the system. Below is the screenshot for the website. It is generally used to visualize the performance of the TensorFlow algorithm and monitor its performance. This Dashboard also comes with a plugin for debugging.
3. TensorBoard visualization
With this visualization, we can use to monitor various things about the out model, such as:
- We can summarize the model.
- View the performance.
- Serialize the data in the model.
- Clean the graph and give proper nomenclature.
- This is basically more or less a monitoring tool used to monitor the performance of our model.
Now moving on to TensorBoard Debugger.
4. TensorBoard Debugger
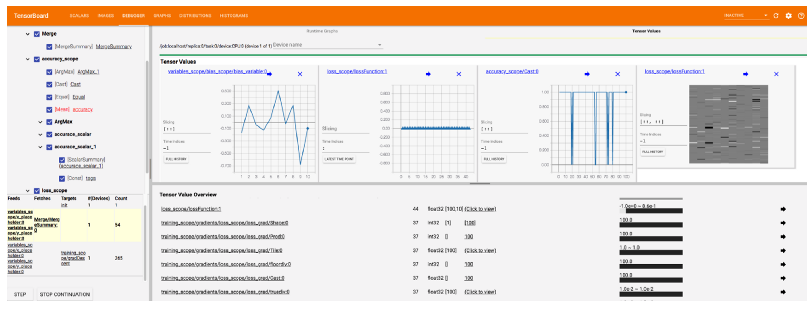
As explained earlier, TensorBoard is a visualizing tool so that visualization can be debugged using this plugin. It provides various cool debugging features such as:
- We can select particular nodes in the Tensor and debug them.
- Graphically we can control the execution of the model.
- And finally, we can also visualize the tensors and their values.
Below is the screenshot of this TensorBoard Debugger in action:
The code TensorFlow packages which are used for the debugging are:
Here tf_debug is the debugger that needs to be imported from the TensorFlow.python package to run the debugging on TensorFlow.
And the below two lines are used to invoke the TenorBoard locally through the terminal.
Advantages of TensorFlow Debugging
There are numerous advantages of the debugging techniques provided in the TensorFlow, such as:
- We can identify we can output value and a particular stage through the use of debugging while the algorithm is getting trained.
- Using the Tensor board application, we can identify and see the performance of our algorithm in a graphical format.
- We can also run the execution of each and every step of our model using the GUI provided in the Tensor Board.
- The TensorBoard application is very user friendly and easy to understand.
- With the use of a debugger or rather Tensor Board, we can identify if we still need more data cleaning is required on our training data.
Conclusion
In this article, we learned about the debugging in TensorFlow, the packages present for TensorFlow’s debugging purpose, and how to implement them. We have also seen the use of tensor board applications, which is a useful tool to debug the algorithm while getting trained.
Recommended Articles
This is a guide to TensorFlow Debugging. Here we also discuss the Introduction and how the debugging works in TensorFlow along with advantages and disadvantages. You may also have a look at the following articles to learn more –


