Updated June 23, 2023
What is the Treynor Ratio?
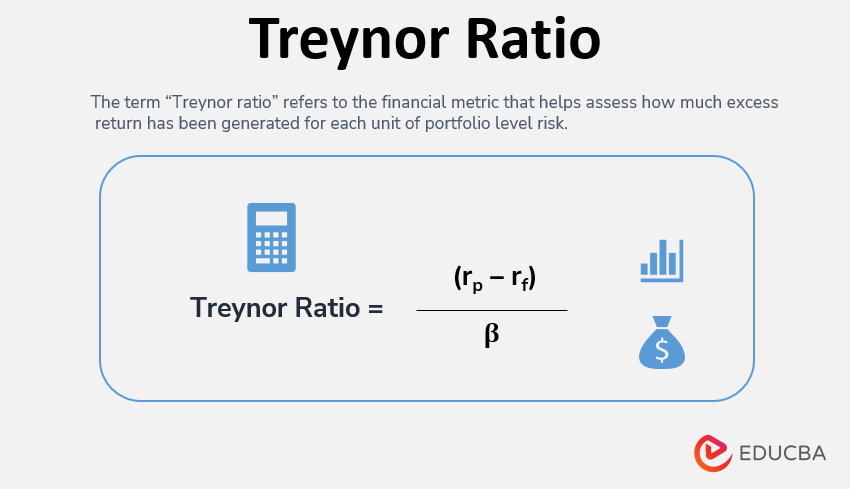
The term “Treynor ratio” refers to the financial metric that helps assess how much excess return has been generated for each unit of portfolio-level risk. Jack Treynor, an American economist and one of the developers of the Capital Asset Pricing Model (CAPM), is credited with naming the Treynor ratio after himself.
Formula
The Treynor ratio expresses the portfolio’s excess rate of return compared to the risk-free rate of return, dividing it by the beta or systematic risk of the portfolio. Mathematically, it is represented as follows:
Example of Treynor Ratio (With Excel Template)
Let’s take an example to understand the calculation in a better manner.
Example #1
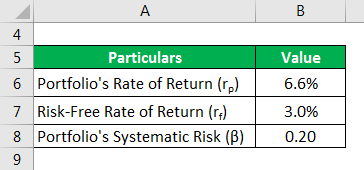
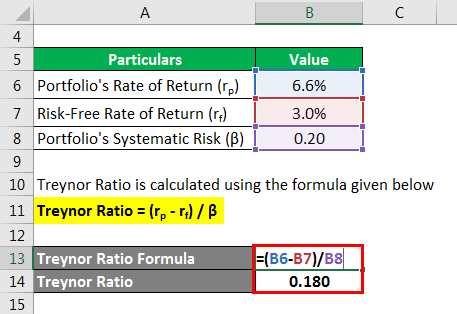
Let us take the example of a mutual fund portfolio to illustrate the Treynor ratio concept. During the last year, the portfolio generated a rate of 6.6%, while the government treasury bills generated a return of 3.0% during the same period. First, calculate the Treynor ratio of the portfolio if its systematic risk is 0.20.
Solution:
The calculation is as follows:
Treynor Ratio = (rp – rf) / β
- Treynor Ratio = (6.6% – 3.0%) / 0.20
- = 0.180
Therefore, the portfolio of mutual funds generated a risk-adjusted return of 0.180 per unit of systematic risk.
Example #2
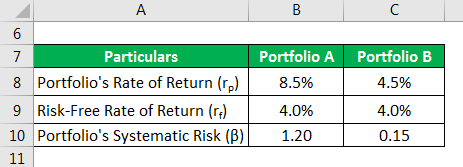
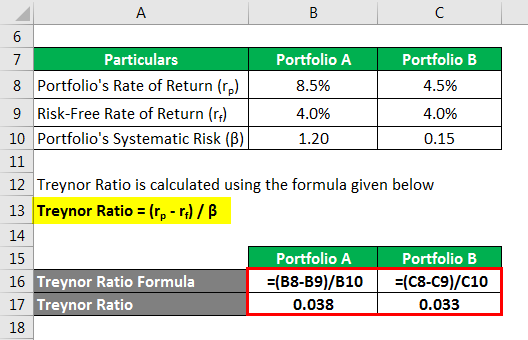
Let us take the example of two portfolios, A and B, to illustrate the use of the Treynor ratio in selecting better investment options. Portfolio A consists of mutual fund investments with higher returns and higher risk, while portfolio B is mostly of government bonds with stable returns and lower risk. The return and systematic risk of portfolio A are 8.5% and 1.2, respectively, while portfolio B’s and systematic risk are 4.5% and 0.15, respectively. Calculate whether portfolio A or B is a better investment option if the risk-free rate of return is 4.0%.
Solution:
It is calculated using the formula given below
Treynor Ratio = (rp – rf) / β
For Portfolio A
- Treynor Ratio = (8.5% – 4.0%) / 1.2
- Treynor Ratio = 0.038
For Portfolio B
- Treynor Ratio = (4.5% – 4.0%) / 0.15
- Treynor Ratio = 0.033
Based on the Treynor ratios, one can conclude that Portfolio A outperforms Portfolio B regarding risk-adjusted returns. Therefore, portfolio A stands as the superior investment option between the two.
Explanation
The formula can be calculated by using the following steps:
Step 1: First, determine the portfolio’s return over a specific period, say a year. The computed rate of return of the portfolio is denoted by rp.
Step 2: Next, ascertain the return for the risk-free rate of return, which is usually the return of long-term government treasury bills. The risk-free rate of return is denoted by rf.
Step 3: Next, calculate the rate of return generated by the portfolio more than the risk-free rate of return, computed by subtracting the risk-free rate of return (step 2) from the portfolio’s rate of return (step 1).
Excess rate of return = rp – rf
Step 4: Next, determine the portfolio’s beta (β), which measures its systematic risk. The beta indicates how the portfolio’s return changes in response to the change in overall market return.
Step 5: The formula is derived by dividing the excess rate of return of the portfolio (step 3) by the portfolio’s beta (step 4).
Treynor ratio = (rp – rf) / β
How does it work?
The risk-adjusted return metric adjusts based on the portfolio’s systematic risk. The financial ratio helps assess whether or not an investment portfolio generates an adequate return rate proportional to its inherent risk. The investment portfolio can be stocks, mutual funds, or exchange-traded funds. In other words, It measures the excess rate of return generated by the investment for each unit of assumed systematic risk. This risk can’t be eliminated even by diversification of investment. Therefore, an investor desires a higher ratio value as it indicates a better return per unit of assumed risk.
Treynor Ratio vs. Sharpe Ratio
The significant differences between the both are as follows:
- It is based on the systematic risk or beta of the portfolio, while the Sharpe ratio is based on the portfolio’s risk or standard deviation.
- It is helpful for a well-diversified portfolio, while the Sharpe ratio can be used in any investment portfolio.
Advantages and Disadvantages
Below are the points that explain the advantages and disadvantages:
Advantages
- It provides ease of comparing performance across the portfolio in terms of return generated per unit of assumed risk.
- It explains the relationship between portfolio return and volatility, hence the reward-to-volatility ratio.
Disadvantages
- Its accuracy is subject to selecting a benchmark for calculating systematic risk. For instance, one will not get the correct outcomes if one uses a large-cap index for measuring the volatility of a portfolio of small-cap stocks.
- An undiversified investment portfolio cannot use as it would carry risks other than the inherent systematic risk.
- It is a backward-looking financial ratio.
Conclusion
So, This is one of the critical performance metrics that analysts and investors widely use for calculating returns generated by investment portfolios.
Recommended Articles
This is a guide to the Treynor Ratio. Here we discuss how to calculate, along with practical examples. We also provide a downloadable Excel template. You may also look at the following articles to learn more –
