Updated July 27, 2023
Uncertainty Formula (Table of Contents)
What is Uncertainty Formula?
In statistical parlance, the term “uncertainty” is associated with a measurement where it refers to the expected variation of the value, which is derived from an average of several readings, from the true mean of the data set or readings.
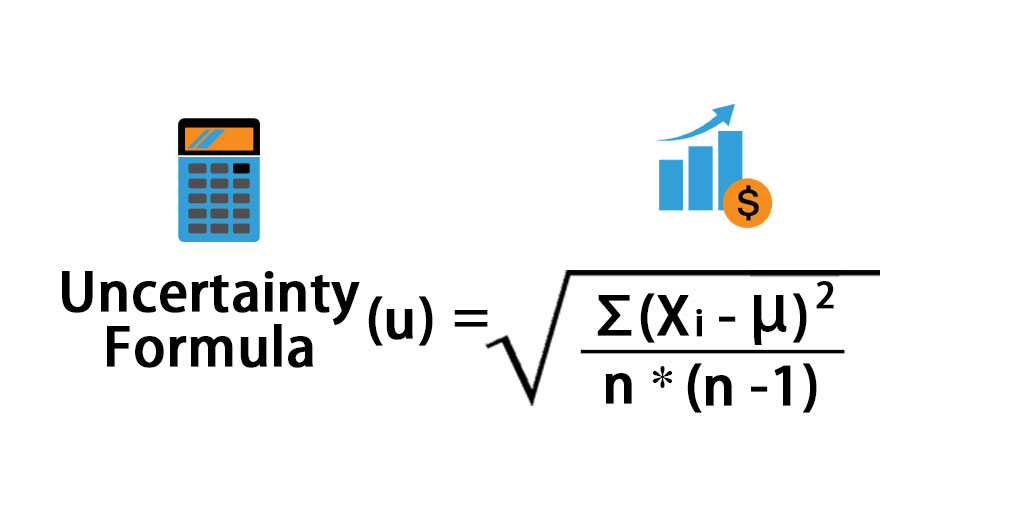
In other words, the uncertainty can be considered as the standard deviation of the mean of the data set. The formula for uncertainty can be derived by summing up the squares of the deviation of each variable from the mean, then divide the result by the product of the number of readings and the number of readings minus one and then compute the square root of the result. Mathematically, Uncertainty Formula is represented as,
Where,
- xi = ith reading in the data set
- μ = Mean of the data set
- n = Number of readings in the data set
Examples of Uncertainty Formula (With Excel Template)
Let’s take an example to understand the calculation of Uncertainty in a better manner.
Uncertainty Formula – Example #1
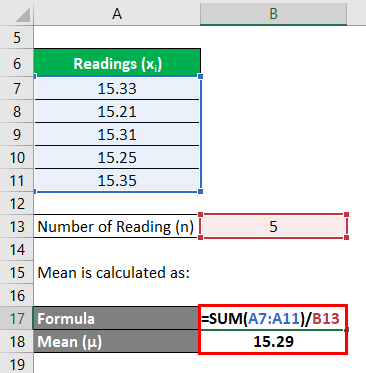
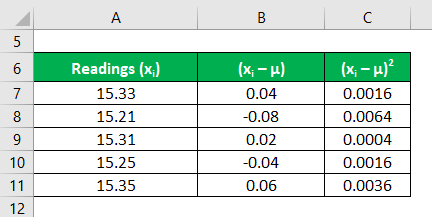
Let us take the example of a 100m race in a school event. The race was timed using five different stopwatches and each stopwatch recorded slightly different timing. The readings are 15.33 seconds, 15.21 seconds, 15.31 seconds, 15.25 seconds and 15.35 seconds. Calculate the uncertainty of the timing based on the given information and present the timing with 68% confidence level.
Solution:
Mean is calculated as:
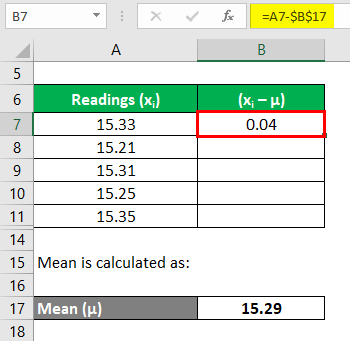
Now, we need to calculate the deviations of each reading
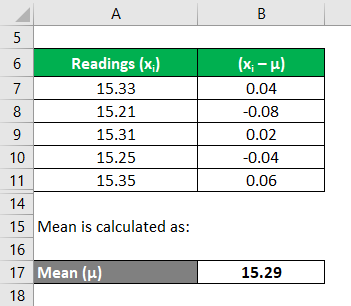
Similarly, calculate for all the readings
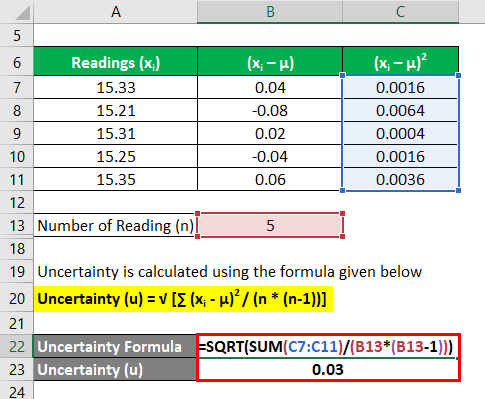
Calculate the square of the deviations of each reading
Uncertainty is calculated using the formula given below
Uncertainty (u) = √ [∑ (xi – μ)2 / (n * (n-1))]
- Uncertainty = 0.03 seconds
68% of values fall within 1 standard deviation of the mean (-1s <= X <= 1s)
So Timing at 68% confidence level = μ ± 1 * u
- Measurement at 68% confidence level = (15.29 ± 1 * 0.03) seconds
- Measurement at 68% confidence level = (15.29 ± 0.03) seconds
Therefore, the uncertainty of the data set is 0.03 seconds and the timing can be represented as (15.29 ± 0.03) seconds at 68% confidence level.
Uncertainty Formula – Example #2
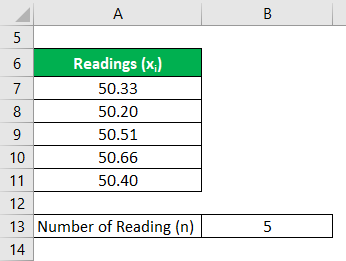
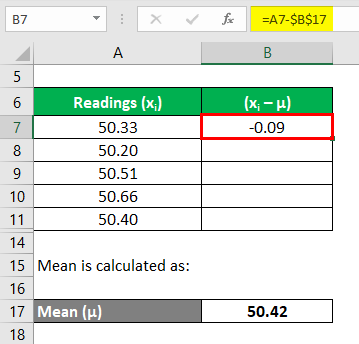
Let us take the example of John who has decided to sell off his real estate property which is a barren land. He wants to measure the available area of the property. As per appointed surveyor, 5 readings have been taken – 50.33 acre, 50.20 acre, 50.51 acre, 50.66 acre, and 50.40 acre. Express the land measurement with 95% and 99% confidence level.
Solution:
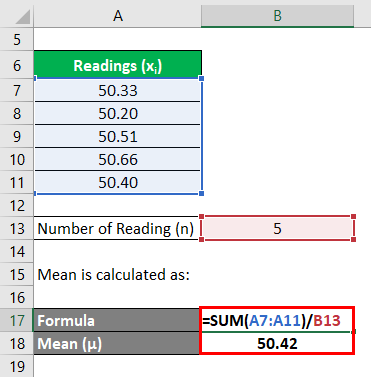
Mean is calculated as:
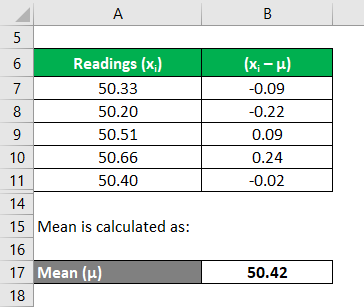
Now, we need to calculate the deviations of each reading
Similarly, calculate for all the readings
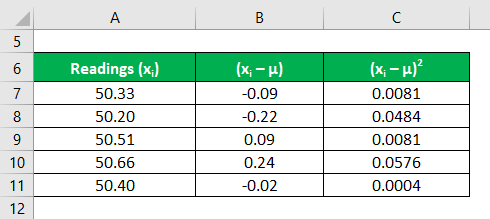
Calculate the square of the deviations of each reading
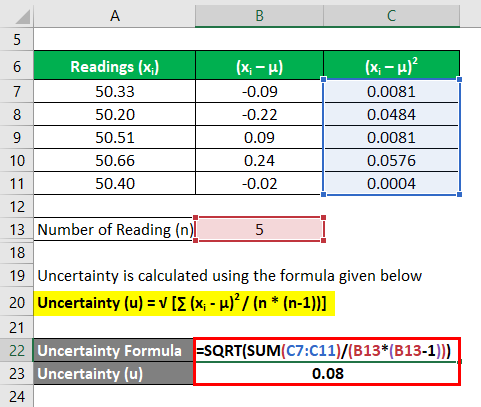
Uncertainty is calculated using the formula given below
Uncertainty (u) = √ [∑ (xi – μ)2 / (n * (n-1))]
- Uncertainty = 0.08 acre
95% of values fall within 1.96 standard deviations of the mean (-1.96s <= X <= 1.96s)
So Measurement at 95% confidence level = μ ± 2 * u
- Measurement at 95% confidence level = (50.42 ± 2 * 0.08) acre
- Measurement at 95% confidence level = (50.42 ± 0.16) acre
99% of values fall within 2.58 standard deviations of the mean (-2.58s <= X <= 2.58s)
Measurement at 99% confidence level = μ ± 3 * u
- Measurement at 99% confidence level = (50.42 ± 3 * 0.08) acre
- Measurement at 99% confidence level = (50.42 ± 0.24) acre
Therefore, the uncertainty of the readings is 0.08 acre and the measurement can be represented as (50.42 ± 0.16) acre and (50.42 ± 0.24) acre at 95% and 99% confidence level.
Explanation
The formula for uncertainty can be derived by using the following steps:
Step 1: Firstly, select the experiment and the variable to be measured.
Step 2: Next, collect a sufficient number of readings for the experiment through repeated measurements. The readings will form the data set and each reading will be denoted by xi.
Step 3: Next, determine the number of readings in the data set, which is denoted by n.
Step 4: Next, calculate the mean of the readings by summing up all the readings in the data set and then divide the result by the number of readings available in the data set. The mean is denoted by μ.
μ = ∑ xi / n
Step 5: Next, calculate the deviation for all the readings in the data set, which is the difference between each reading and the mean i.e. (xi – μ).
Step 6: Next, compute the square of all the deviations i.e. (xi – μ)2.
Step 7: Next, sum up all the squared deviations i.e. ∑(xi – μ)2.
Step 8: Next, the above sum is divided by the product of a number of readings and number of readings minus one i.e. n * (n – 1).
Step 9: Finally, the formula for uncertainty can be derived by calculating the square root of the above result as shown below.
Uncertainty (u) = √ (∑ (xi – μ)2) / (n * (n-1))
Relevance and Uses of Uncertainty Formula
From the perspective statistical experiments, the concept of uncertainty is very important because it helps a statistician to determine the variability in the readings and estimate the measurement with a certain level of confidence. However, the precision of the uncertainty is only as good as the readings taken by the measurer. Uncertainty helps in estimating the best approximation for a measurement.
Recommended Articles
This has been a guide to Uncertainty Formula. Here we discuss how to calculate the Uncertainty using formula along with practical examples and downloadable excel template. You may also look at the following articles to learn more –
