Excel VBA Pivot Table
VBA Pivot Table helps you to summarize reports from a large data set. Pivot can consider as a tiny form of the entire data set. A quick view of large data set is possible through a pivot table. A pivot table is an easy way to filter data accordingly. From the available data, you can highlight data the way you want. A pivot table allows you to combine the huge data analyze the data, and produce reports which meet your business requirements.
Excel offers a built-in pivot table which is easy to create by applying a pivot table over a datasheet. It is possible to generate a report automatically in excel once the data is supplied. VBA codes will help you to create an automatic pivot table.
How to Create a Pivot Table Using Excel VBA?
The common steps to insert a pivot table are first inserting a pivot table from the Insert menu, then selecting the tables you want to change into a pivot table. The selected table will become the source data, and the pivot table will be created accordingly.
To build a pivot report, you have to select the fields to the filters, values, etc. In a similar way, these steps can be automated using the VBA codes. We need an excel sheet of data to operate with a pivot table. Let’s learn how to create a pivot table through the Excel VBA codes.
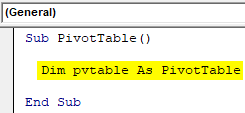
Step1: Pivot table should consider as a reference object. Create an object for the pivot table; this object will be used to point to the pivot table on further codes. Name the variable as pvtable. Declare a function and pivot table object.
Code:
Sub PivotTable()

  Dim pvtable As PivotTable

End Sub
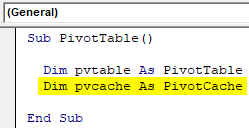
Step 2: To keep the data files, we need a pivot cache to declare the source of the data. Before creating a pivot table, declare a pivot cash variable. Declare the variable pvcache for pivot cache.
Code:
Dim pvcache As PivotCache
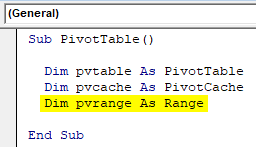
Step 3: The data is within the worksheet and should specify a range to hit the cell that you need. In the pivot table, the source data is spread as rows and columns so to point to a particular range; we need a variable. Define pvrange as a range variable.
Code:
Dim pvrange As Range
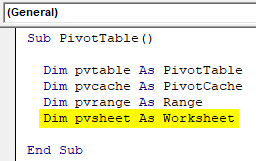
Step 4: A worksheet needs to insert the pivot table which you need to create. Declare a variable as a worksheet. Define pvsheet as a worksheet.
Code:
Dim pvsheet As Worksheet
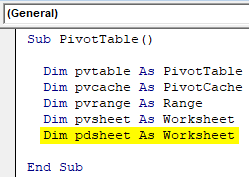
Step 5: You need a similar variable to use the datasheet, which should contain the data you want to plot as a pivot table. So the datasheet variable is declared as pdsheet.
Code:
Dim pdsheet As Worksheet
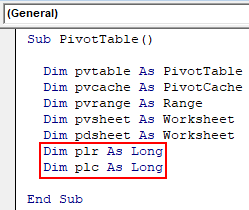
Step 6: You need two more variables as long datatype to indicate the last used row and column for pivot table creation. This can be any row or column, so there are chances to be a number of rows and columns beyond the integer data type limit. Let’s name it plr and plc.
Code:
Dim plr As Long
Dim plc As Long
Step 7: The next step is to delete if there is any pivot table already created. This will help to avoid confusions on which table the source data to be plotted. To delete the previous pivot table sheet and create a new sheet to insert the pivot table.
Code:
On Error Resume Next
Application.DisplayAlerts = False
Application.ScreenUpdating = False

Worksheets("pvsheet").Delete 'to delete the exisiting pivot table in the worksheet
Worksheets.Add After:=ActiveSheet ' to add a new worksheet

ActiveSheet.Name = "pvsheet" ' to rename the worksheet into "pvsheet"
On Error GoTo 0
Step 8: Assign an object variable for the pivoting sheet and data sheet respectively to the variables pvsheet and pdsheet. This will be used further for specifying the worksheets.
Code:
Set pvsheet = Worksheets("pvsheet")
Set pdsheet = Worksheets("pdsheet")
Step 9: Once the worksheets are set, the next item is we need the last used row and column for creating a pivot report. Find the last used row and column using the declared variables plr and plc.
Code:
'two variable to find Last used row and column in pdsheet
plr = pdsheet.Cells(Rows.Count, 1).End(xlUp).Row
plc = pdsheet.Cells(1, Columns.Count).End(xlToLeft).Column
Step 10: Like we mentioned previously, the range of cells specifies the data in the worksheet. You have to set the pivot range in the next step. It is already declared as a variable to use the pivot range “pvrange”.
Code:
'initializing pivot table data range
Set pvrange = pdsheet.Cells(1, 1).Resize(plr, plc)
Since the range is set using resize property of cell ranges, it will resize the pvrange will adjust the pivot range accordingly. So the pvrange will adjust is there any addition or deletion of the rows or column happen.
Step 11: It’s time to set the pivot cache, which is the pivot table’s source. Use the object pvcache to set the source cache.
Code:
'pivot cahe
Set pvcache = ActiveWorkbook.PivotCaches.Create(xlDatabase, SourceData:=pvrange)
Step 12: Here, the Sales report for different products will be converted into a pivot table through this. Create a pivot table as blank to which you can add the data set further.
Code:
'new blank pivot table
Set pvtable = pvcache.CreatePivotTable(TableDestination:=pvsheet.Cells(1, 1), TableName:="Sales_Report")
Step 13: Once the pivot is inserted, you have to specify the different fields you want to insert to the pivot table. So insert the first-row field. Here the first row starts with the product.
Code:
'Insert Product to Row Filed
With pvsheet.PivotTables("Sales_Report").PivotFields("Product")
  .Orientation = xlRowField
  .Position = 1
End With
Step 14: The next is to specify the second field you want to insert to the pivot table. In the same way, insert the second-row field street to the pivot table.
Code:
'Insert Street to Row Filed & position 2
With pvsheet.PivotTables("Sales_Report").PivotFields("Street")
  .Orientation = xlRowField
  .Position = 2
End With
Step 15: Insert the next field to the pivot table, and the next is a town. Give the code to insert the town field.
Code:
'Insert town to Column Filed
With pvsheet.PivotTables("Sales_Report").PivotFields("Town")
  .Orientation = xlColumnField
  .Position = 1
End With
Step 16: Till this, the data inserted were text type. Now we need to insert the number of sales to the pivot table.
Code:
'Insert Sales column to the data field
With pvsheet.PivotTables("Sales_Report").PivotFields("Sales")
  .Orientation = xlDataField
  .Position = 1
End With
Step 17: You have inserted the fields that need to create a pivot table. And the pivot table is almost finished now; you can set the format of the pivot table. This will specify the type of table through table style. Row Axis Layout is also set in the way you want.
Code:
'set the format Pivot Table
pvsheet.PivotTables("Sales_Report").ShowTableStyleRowStripes = True
pvsheet.PivotTables("Sales_Report").TableStyle2 = "PivotStyleMedium14"
Step 18: To show the row filed values items in tabular form, add the below code at the bottom.
Code:
'to show the pivot table in Tabular form
pvsheet.PivotTables("Sales_Report").RowAxisLayout xlTabularRow

Application.DisplayAlerts = True
Application.ScreenUpdating = True
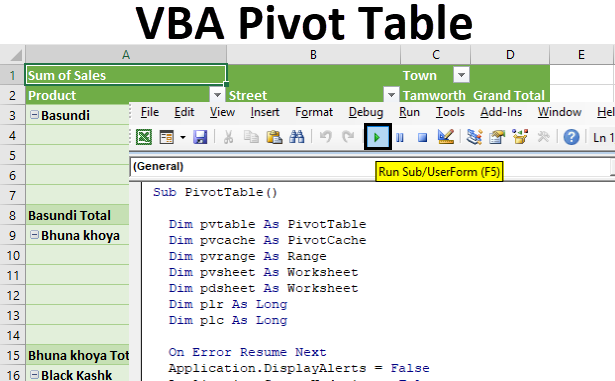
Step 19: Press the run button or hit F5 to run the code. This will produce a pivot table from the data source sheet. The data given in rows and columns will be changed into the pivot table. The pivot table will be visible on the pivot table worksheet.
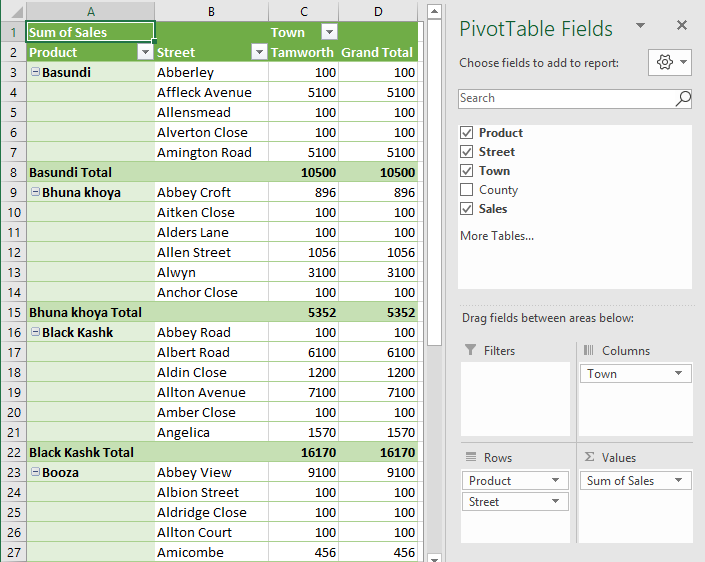
Check the output, and you can see the data source is converted into the pivot table as below; the mentioned columns are converted into the filter forms.
Pivot fields are visible on the right side. You can make changes according to your need for how the data needs to showcase.
For your reference, I have given the code below.
Code:
Sub PivotTable()

  Dim pvtable As PivotTable
  Dim pvcache As PivotCache
  Dim pvrange As Range
  Dim pvsheet As Worksheet
  Dim pdsheet As Worksheet
  Dim plr As Long
  Dim plc As Long

  On Error Resume Next
  Application.DisplayAlerts = False
  Application.ScreenUpdating = False

  Worksheets("pvsheet").Delete 'to delete the exisiting pivot table in the worksheet
  Worksheets.Add After:=ActiveSheet ' to add a new worksheet

  ActiveSheet.Name = "pvsheet" ' to rename the worksheet into "pvsheet"
  On Error GoTo 0

  Set pvsheet = Worksheets("pvsheet")
  Set pdsheet = Worksheets("pdsheet")

  'two variable to find Last used row and column in pdsheet
  plr = pdsheet.Cells(Rows.Count, 1).End(xlUp).Row
  plc = pdsheet.Cells(1, Columns.Count).End(xlToLeft).Column

  'initializing pivot table data range
  Set pvrange = pdsheet.Cells(1, 1).Resize(plr, plc)

  'pivot cahe
  Set pvcache = ActiveWorkbook.PivotCaches.Create(xlDatabase, SourceData:=pvrange)

  'new blank pivot table
  Set pvtable = pvcache.CreatePivotTable(TableDestination:=pvsheet.Cells(1, 1), TableName:="Sales_Report")

  'Insert Product to Row Filed
  With pvsheet.PivotTables("Sales_Report").PivotFields("Product")
    .Orientation = xlRowField
    .Position = 1
  End With

  'Insert Street to Row Filed & position 2
  With pvsheet.PivotTables("Sales_Report").PivotFields("Street")
    .Orientation = xlRowField
    .Position = 2
  End With

  'Insert town to Column Filed
  With pvsheet.PivotTables("Sales_Report").PivotFields("Town")
    .Orientation = xlColumnField
    .Position = 1
  End With

  'Insert Sales column to the data field
  With pvsheet.PivotTables("Sales_Report").PivotFields("Sales")
    .Orientation = xlDataField
    .Position = 1
  End With

  'set the format Pivot Table
  pvsheet.PivotTables("Sales_Report").ShowTableStyleRowStripes = True
  pvsheet.PivotTables("Sales_Report").TableStyle2 = "PivotStyleMedium14"

  'to show the pivot table in Tabular form
  pvsheet.PivotTables("Sales_Report").RowAxisLayout xlTabularRow

  Application.DisplayAlerts = True
  Application.ScreenUpdating = True

End Sub
Things to Remember
- Specify the source sheet where the data is to supply for a pivot table.
- Starting row and column should be mentioned properly.
- Use the necessary objects to pinpoint the pivot cache, range, starting and ending of rows.
- Arrange the data source with the proper format since this is the automation process.
Recommended Articles
This is a guide to VBA Pivot Table. Here we discuss how to create a pivot table using VBA codes in excel along with an example and downloadable excel template. You may also look at the following articles to learn more –
