Introduction to Vue.js devtools
The following article provides an outline for Vue.js devtools. To maintain and track any application failure and error cause we need some tools available which helps us to debug the code at front end to understand the error. For this we have devtools available which is a short form of developers tools. This helps us to track the activity of the application and helps us to debug them in the browser only. To run test this, we need to have Vue application running in our browser.
How devtools works in Vue.js?
In order to use developer’s tool we should have an application running in the browser. This is like same way to use to debug the typescript code in the browser. In order to start we will first create an Vue application which will hold the Vue code and we will run this application in the browser.
Let’s see the steps in detail:
1. In order to start we will first create an application in Vue.js. We have Vue cli in place already and by using this we will install the required things.
2. For this we need to install the Vue.js devtools tool extension for the chrome browser and this will be specific to Google chrome only. Also we need to update some of the files in Vue.js. First we will update the webpack in order to debug our code from the vue code. This step will help us to compress and build the source code. This step will give an assurance that this application can be debug from the browser. If you try to open the Vue.js application code you will see one structure which will contain the following files one is Index.js and another one is Vue-config.js, in both these files we need to do some configuration in order to make this developer’s tool works.
- Index.js: In this file we will add one property which is called as devtool and need to give it one value. It works as the key value pair we can say one is key and another its value. This file can be found under the config folder named as index.js. This property needs to be added if we are using CLI 2 version.
Property:
devtool: 'source-map'- vue.config.js: In this file we need to do some more configuration to build the source map and enable the devtool working for the application to debug. We need to add two property here, it look like a json structure.
Property:
module.exports = {
configureWebpack: {
devtool: 'source-map'
}
}
In this above property we are adding the devtool property inside the configure Webpack and binding its value to source-map. This will also do the same thing like above build the source map.
Now we can see the debug icon in the Vue code but before starting the debug of the application we need to replace some files.
- launch.json: This file is used to launch the application with some modification in the configuration. We will see the configuration for chrome browser here.
We are setting parameters those are type, request, name, url, webroot, breakOnLoad, sourceMapPathOverrides.
- type: This is the variable inside the configurations object so we can say this is its property. Here we are mentioning the browser name as ‘chrome’.
- request: This is also an property of the configurations object we can say and we are assigning its value as ‘launch’.
- name: This variable is assigned as the value ‘vuejs: chrome’.
- url: This is important because it will point to the url of our application on which it is going to run. This will contain the port number as well. Also we have provide the path for webpack here.
By using the developer’s tool we can put the break points as well. Breakpoints are nothing but the line where we want to have control of. By putting the break points we can debug our code and can check what is the value coming from the server or what operation are performed.
Now we are all ready to run our application and see whether the debug is working not with the developers tools.
So in order to test it we will run our application. To run our application we can use the following command shown below:
Code:
npm run serverThis command will start our application on the specified port and url given by the developer. But we can also check them in npm logs if you are running for the first time. Once you run it you will see that you have control of the line where you have out your breakpoints enable in the program and the debug will stuck at the breakpoints. This debug process works in the same way like it work for other languages but the difference here is we are making some configuration to make it enable. If we see other back end editors like eclipse, intellij this feature is already available we do not need to do anything to use them.
If you want to use any available dev tools for which we do not need to do any configuration, then we can do for chrome developer tools option available for us. It is very easy to use and explore.
Examples of Vue.js devtools
Given below are the examples of Vue.js devtools:
Example #1
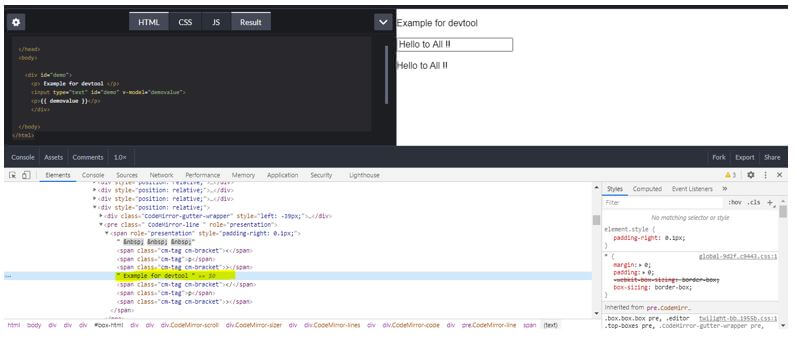
This is just a simple example to print the message on the UI. But by debugging it we can see the html file and Vue.js code for better understanding.
HTML File:
<html>
<head>
</head>
<body>
<div id="demo">
<p> Example for devtool </p>
<input type="text" id="demo" v-model="demovalue">
<p>{{ demovalue }}</p>
</div>
</body>
</html>
Vus.js File:
new Vue({
el: '#demo',
data: {
demovalue: 'Hello to All !!'
}
})
Output:
Example #2
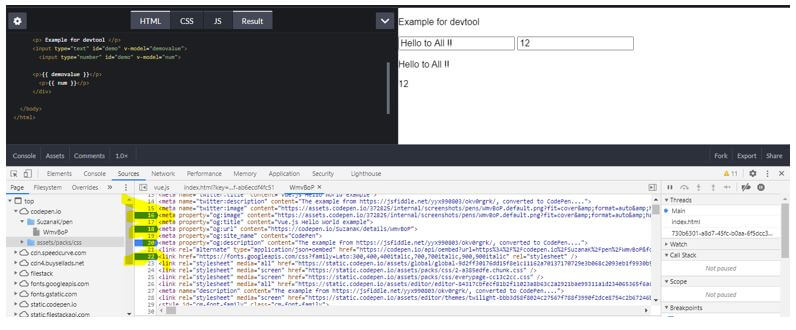
In this example we will see the file code from the developer’s tool window and see how we have put the debug point there. In this we have put some debug pint by using the developers tools options.
HTML File:
<html>
<head>
</head>
<body>
<div id="demo">
<p> Example for devtool </p>
<input type="text" id="demo" v-model="demovalue">
<input type="number" id="demo" v-model="num">
<p>{{ demovalue }}</p>
<p>{{ num }}</p>
</div>
</body>
</html>
Vue.js Field:
new Vue({
el: '#demo',
data: {
demovalue: 'Hello to All !!',
num: 10
}
})
Output:
Conclusion
By using developer tools we can easily debug our application and identify the error which can be of any kind. Also we can track the data which is coming from the server that we have to display to the user. If any error or we are receiving the null object we can easily report it. It also prints the exception on the console window we can track the error from there also.
Recommended Articles
This is a guide to Vue.js devtools. Here we discuss the introduction and working of devtools in Vue.js along with examples and code implementation. You may also have a look at the following articles to learn more –


