Updated March 24, 2023

Introduction to Decision Tree
Decision Tree is the hierarchical tree-structured algorithm that is used for derived a meaningful output from a variety of inputs. The output fetched from this kind of hierarchical arrangement is considered a valuable contribution for producing analytical results for essential business decision-making. Hence the name Decision Tree is given to this algorithm. Business professionals seek assistance from the decision tree when the data under evaluation is huge in volume and it is impossible to go through the bulky fractions of data manually.
What is Decision Tree?
Now let us take a deep dive into what category Decision tree falls in and what exactly we mean by the term decision tree. As we discussed previously, the Decision tree falls under the category of Supervised learning. Supervised learning is a part of machine learning in which a model is trained on the data with output features in place in the dataset. In layman terms, we mean that we already know what the output is, and on the basis of that we look at the input features and try to come up with training a model to get to the output variable or feature.
Now coming to what Decision Trees are. A decision tree is an algorithm that makes a tree-like structure or a flowchart like structure wherein at every level or what we term as the node is basically a test working on a feature. This test basically acts on a feature on the basis of the criterion described later in the article. Also, one thing to keep in mind is that in the starting node entire dataset falls into one category and subsequently in each layer, the split of the data will happen.
| Age | A lot of Junk food | Exercise | Fit/Unfit |
| 45 | No | No | Unfit |
| 40 | No | Yes | Fit |
| 25 | Yes | No | Unfit |
| 29 | No | Yes | Fit |
| 23 | Yes | Yes | Unfit |
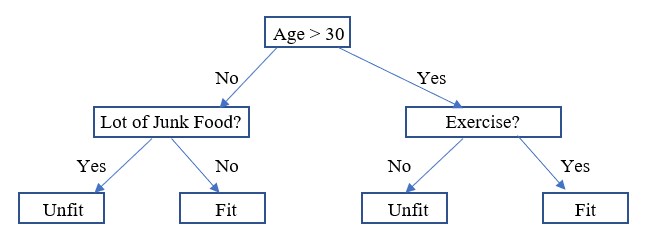
In the below diagram, we would look at how to read a decision tree for the table mentioned with data.
In the above diagram we read the decision tree as if the age of the person is more than 30, then check if the person is exercising or not. If yes then the person is fit, otherwise, the person is unfit. Now if the person is below 30 years then check if the person is eating a lot of Junk food or not. If the person is then the person is unfit otherwise the person is fit.
Understanding of the Decision Tree
Now as we look at each layer we check for a particular feature. This is what we were talking in the previous section that at each layer we test on a particular feature. Let us now get an intuitive look at how we decide on which feature do we need to test so that we get an optimal split.
If you look at the data, any person more than 30 years of age has “a lot of junk food” as No. That means that this particular feature for a person more than 30 years of age do not segregate the Fit/Unfit. But if we look at the “Exercise” feature the difference in the Yes or No segregates the Fit/Unfit label. This means that if we check the feature of “Exercise” we would get the most optimal split.
Now for a person less than 30 years of age, the scenario might be a bit different. In this, if the “Lot of Junk food” is a Yes, it is always “Unfit” whereas data might not be that sufficient to signify if the “Exercise” plays a role. Thus, “Lot of Junk food” actually plays a role and for “Exercise” we don’t have data substantiating the optimal split and hence choose “Lot of Junk food” to split our data.
Now coming on to mathematical reasons on how we determine using the algorithm. We have something known as “Information Gain” (IG) and the “Gini Index” for understanding which features we split on used widely. For information gain, we calculate the entropy of different splits created using the different features we have. Entropy is nothing but randomness and Information Gain is the difference of Entropy before the split and after the split, Also, we want to have the least randomness after the split, and thus more information gain post-split. For the “Gini Index,” it is nothing but the probability of a particular variable being wrongly classified if chosen randomly. In layman terms, if we want to differentiate between them, IG tries to decrease the randomness which means that the classes proportion in each split is equal in probability whereas in Gini it will try to split with pure classes in split node post-split.
Where do we Use the Decision Tree?
Now everyone reading this article must be looking at where we would use decision trees.
- Strategy Planning: Knowing which areas one business should focus on.
- Product Planning: Understanding what features in a product impact the sale of the product.
- Due to its in-built feature of feature importance, we use it in financial use cases on understanding what feature impacts the prediction.
- Understanding if a loan for a particular customer would be successfully recovered or not.
- Decision Tree is capable of handling both Classification and regression problems.
Benefits of Decision Tree
Given below are the benefits mentioned:
- Due to the in-built tree structure decision tree, it is easy to understand the intuition behind the split of data.
- It is widely used as a part of data exploration.
- It has very little human intervention.
- The categorical and numerical features can be handled in the input features.
Conclusion
Thus, in conclusion, the decision tree has a whole new dimension that other algorithms fail to touch upon and that is the non-linearity of features. Since there is no assumption of linearity hence it does cater to the non-linear datasets as well. And decision tree, being a flowchart like structure makes it a widely used algorithm in the world of Data Science.
Recommended Articles
This is a guide to What is Decision Tree? Here we discuss the introduction, understanding, use, and benefit of a decision tree. You may also look at the following articles to learn more –

