Updated March 28, 2023
Introduction of K Map
K map is a popular terminology with its full form Karnaugh map, and it is further abbreviated as KM. The main functionality of the K map is to make Boolean Algebra expression simple. It uses a pictorial style in minimizing the Boolean expression. K map obviates the need to use complex Boolean theorems and maneuvering equations. KM can be considered as a different improvised version of the truth table. This methodology minimizes the Boolean expression with two to four variables easily. Expression with five to six variables can be resolved with some difficulty, and anything more is extremely difficult.
K map avoids the usage of extensive calculations by using visual techniques. It exploits natural instinct present in Human beings in interpreting visual patterns easily, thereby avoiding complex computations. Furthermore, it eliminates race conditions and enables rapid resolution. Before getting into an actual methodology, let us go through some basics.
Explanation of K Map
An explanation of the k map is given below:
1. Boolean Expression
Boolean expression is a statement when evaluated, will either have a true value or false value. In this expression, you can compare any data with another for data of the same type for equality or greater than or less than. Boolean data will have
- Boolean values like yes or no, true or false, and on and off
- Formula or variables
- A function that generates results
- Values out of comparison operations
Examples A >50, B < 25, (A+B+C) < (D+E+F), A can walk, Water is Hot, and each expression results is in true or false condition.
2. Logical Operators
The complex expression can be formed by connecting individual expression with the help of connectors, and the new expression will get evaluated. Various connectors are
- AND (&&) results in true status if all the individual expressions are true
- OR (||) results in true status if at least one of them is true
- Exclusive or (^) results in true status if at least one of them is true not all the conditions
- NOT (!) reset false to true and vice versa
- Implication ( ) Logicallyimplies
3. Truth Table
The truth table denotes Boolean logic in the form of a two-dimensional mathematical table representing boolean algebra, functions, and propositional calculus. Each row in this table denotes a combination of truth values of all propositions covered in the problem. It is a chart showing all possible permutations and combinations of values of all Boolean expressions in a problem that has compounded expressions, line by line with its truth value.
If there are two propositions in a given problem, there would be four rows covering each combination’s possible true and false and truth values. Similarly, the three propositions truth table will have eight combinations, and four propositions will have sixteen rows.
How does it Work?
Simplifying expression using Boolean algebra techniques is cumbersome as one will have to remember many formulas, and the solution provided by this method is sub-optimal. However, the solution is not minimal though it appears to be minimal. Karnaugh provides a simple and straight method in minimizing Boolean expressions. In the Pictorial method provided by KM, all the expressions with common factors are grouped together, thereby eliminating superfluous variables.
The truth table with all possible combinations of individual values of expression is created first, and the truth results of all combinations are moved into cells of a two-dimension array called k map. Each cell represents the truth value result of a row in the truth table. Ideal groups of 1s or 0s are formed from this grid that represents logic from the parent truth table in canonical form. These groups are used to generate minimal Boolean expressions.
KM offers a simplified logic structure that can be implemented using minimum possible logic gates. Two major categories of KM
- And gates feeding OR gate – Sum of Productsexpression
- OR gates feeding And gate – Product of Sumsexpression
Post Minimization the canonical form of the above two categories can be directly implemented using logical operators AND & OR.
Example of the Map
A truth table for 4 variable functions and its truth value
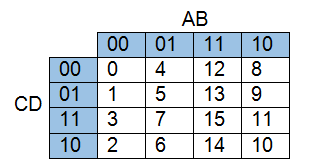
K map gird for this truth table is given below. The sequence of column heading or row heading should be in such a way that there should be a change in one bit only, and it is known as cycle code.
The functional values of a particular combination is moved to the corresponding cell of the K map grid. For example, minterms are mapped with value 1, and max terms are mapped with value 0.
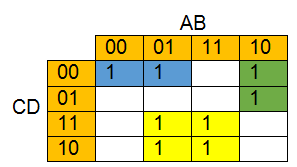
Minterm functionf(A,B,C,D)= (0,4,6,7,8,9,14,15).
To simplify the expression 3 canonical forms of square or rectangle sizes are formed, which are adjacent cells having the value “1”.
- Yellow Group: Column wise B remains the same, and A Changes. Row wise C remains the same and D changes, and hence the result of minterm for this form is BC.
- Blue Group: Column wise A remains the same and B changes, and row-wise CD remains the same, and the result of minterm for this form is A’C’D’ ( A C D have zeroes)
- Green Group: Column-wise, AB remains the same and row-wise, C remains the same, and D changes. The result is AB’C’ ( B C have zeroes)
- Simplified solution of K map is minterm f (A,B,C,D) = BC + A’C’D’ + AB’C’
Recommended Articles
This is a guide to What is K Map?. Here we also discuss the introduction and how does it work? Along with an example. You may also have a look at the following articles to learn more –


