Updated February 28, 2023

What is Linear Regression?
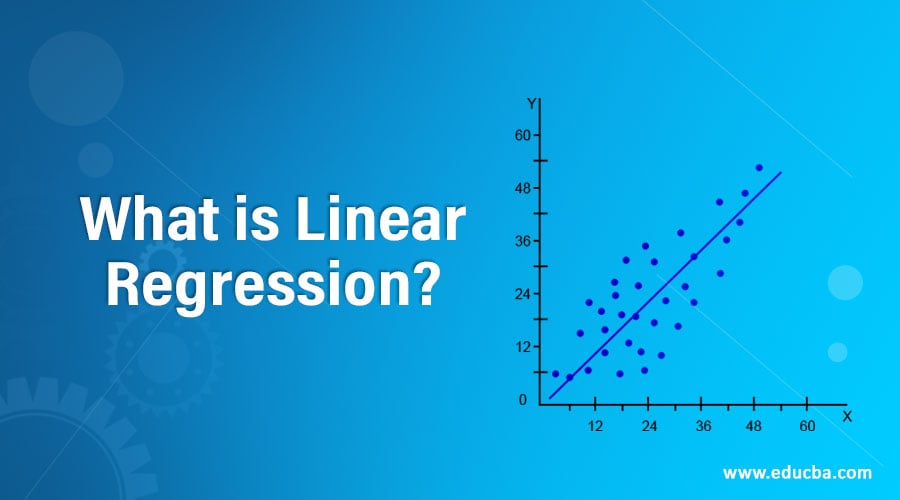
Linear regression is one of the ways to perform predictive analysis. It is used to examine regression estimates.
- To predict the outcome from the set of predictor variables
- Which predictor variables have maximum influence on the outcome variable?
The regression estimates explain the relationship between one dependent variable and one or more independent variables. The same is represented in the below equation.
The formula for linear Regression:
- x: Score of the independent variable
- m: Regression coefficient
- c: Constant
- x: Independent variable
The variable names may differ. The regression dependent variable can be called as outcome variable or criterion variable or an endogenous variable. The independent variable can also be called an exogenous variable.
Why we Use Linear Regression?
Linear regression is used to perform regression analysis. Below are the uses of regression analysis.
- Help determine the strength of Predictors: This technique is used in sales and marketing. Predictive analysis helps in understanding the relationship between the predictor and outcome variable (i.e. dose and effect).
- Forecast the effect through Prediction: The change in the dependent variable will cause a difference in an independent variable. For example, if you spend more money on marketing a product it can affect the sales to increase or decrease.
- Trend Analysis / Forecasting: Regression analysis is used to predict future trends especially in the share market where there are fluctuations and inflation in prices.
Types of Linear Regression
Below are the 5 types of Linear regression:
1. Simple Linear Regression
Simple regression has one dependent variable (interval or ratio), one independent variable (interval or ratio or dichotomous). The example can be measuring a child’s height every year of growth. The usual growth is 3 inches. Many such real-world examples can be categorized under simple linear regression.
2. Multiple Linear Regression
Multiple regression is used when we have two independent variables and one dependent variable. We can determine what effect the independent variables have on a dependent variable.
In Multiple regression, we can suppose x to be a series of independent variables (x1, x2 …) and Y to be a dependent variable. We also have b as the slope of a regression variable. Below is the equation that represents the relation between x and y.
The example that can be categorized under multiple regression is calculating blood pressure where the independent variables can be height, weight, amount of exercise. The selection of variables is also important while performing multiple regression analysis. We should understand are important variables and unimportant variables before we create a model.
3. Logistic Regression
Logistic regression is done when there are one dependent variable and two independent variables. The difference between multiple and logistic regression is that the target variable is discrete (binary or an ordinal value). The problem with linear regression is the variable value is fixed only to two possible outcomes. Logistic regression, on the other hand, can return a probability score that reflects on the occurrence of a particular event.
Logistic regression is used in several different cases like detecting spam emails, predicting a customer loan amount, whether a person will buy a particular product or not. Logistic regression is good at determining the probability of an event occurrence. Logistic regression is used in several machine learning algorithms.
4. Ordinal Regression
Ordinal regression is performed on one dependent dichotomous variable and one independent variable which can be ordinal or nominal. Ordinal regression can be performed using the Generalised linear model (GLM).In machine learning terms, it is also called a ranking analysis.
In marketing, Ordinal regression is used to predict whether a purchase of the product can lead a consumer can buy a related product. For example, if a consumer buys a pizza, how is he /she likely to order a soft drink along with it. Further considering the quantity of a soft drink. Various factors affect the order of a soft drink like the size of the pizza ordered and complimentary food items given along with the order. Remember, there is also a difference between the prices of soft drinks along with the quantity.
5. Multinomial Regression
Multinomial regression is done on one nominal dependent variable and one independent variable which is the ratio, interval, or dichotomous.
An example of Multinomial regression can be occupational preferences among the students that dependent on the parent’s occupation and education.
Importance of Regression Analysis
Below are the importance mentioned:
- Regression analysis helps in understanding the various data points and the relationship between them. It is considered to be significant in business models.
- Regression analysis is also used for forecasting and prediction.
- Understanding the data and relationship between them helps businesses to grow and analyze certain trends or patterns. It can provide new insights to businesses and is valuable.
- While plotting the data points, Regression analysis helps to understand the failures of a company and correct them to succeed by avoiding mistakes. This kind of analysis will help when a new product is launched into the market and determine the success of that product.
- Regression analysis also helps the company provide maximum efficiency and refine its processes.
Recommended Articles
This is a guide to What is Linear Regression?. Here we discuss how to use linear regression, the top 5 types, and importance in detail understanding. You can also go through our other related articles to learn more –
