Updated June 29, 2023
What is QlikView?
QlikView is a business intelligence and data discovery platform allowing users to create interactive data visualizations and analyze large and complex datasets. Qlik, a software company based in Radnor, Pennsylvania, developed it.
QlikView uses an in-memory data processing engine to store and retrieve data quickly. Its user interface allows users to easily create dynamic, interactive dashboards and reports. It also includes a wide range of data visualization tools and features, including charts, graphs, tables, and more.
QlikView can integrate data from multiple sources, including databases, spreadsheets, and other applications. This allows users to access and analyze data across their organization in a single platform. Additionally, It includes advanced analytics features such as predictive analytics, data mining, and statistical analysis.
History of QlikView
- QlikView was developed in Sweden in 1993 by Staffan Gestrliu and Bjorn Berg; it is a software company based in Pennsylvania. It is also called QuikView. A group of entrepreneurs started the company and intended to develop a tool that would enable users to easily and quickly analyze data without the need for complex coding or database skills.
- The first version of Qlikview was released in 1994 and was based on the principle called “associative data modeling,” which enables users to analyze data in a non-linear way.
- Qlikview 2 was released in 1996 that includes several new features and enhancements compared to the first version. The first two versions of QlikView were developed with the help of Excel and VLOOKUPs.
- Over the years, Qlikview evolved into a full-fledged business intelligence platform with features like transformation extract and loading(ETL) in customizable dashboards and reports.
- Today it is the most widely used business intelligence platform in the world. It is located worldwide, has 1400 employees, and has 28000 customers. QuikView also has partnerships with HP and Intel, and it has 1500 partners around the world. In April 2021, the market for QlikView was $2 billion.
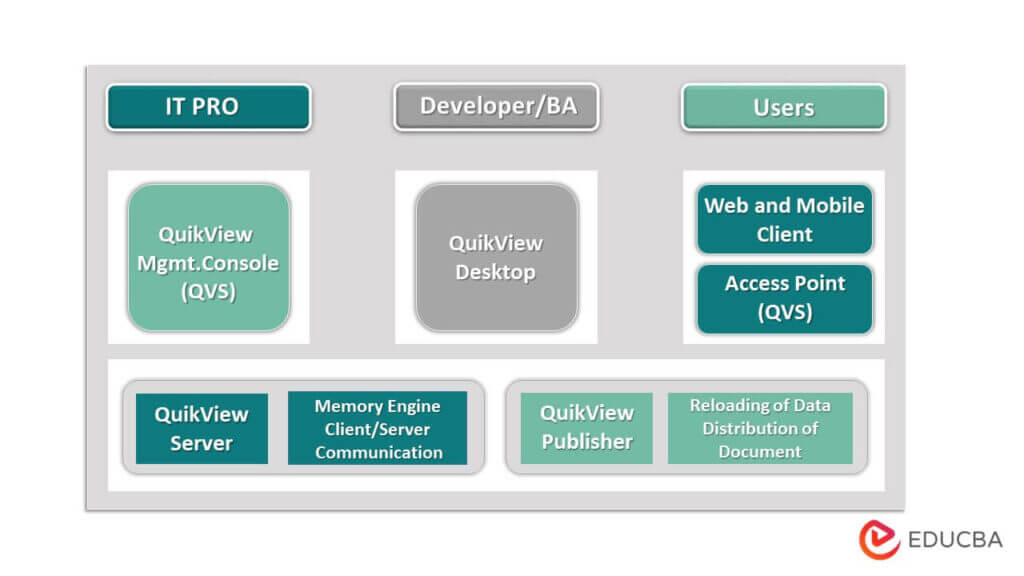
QlikView Architecture
The Front end and Back end are the software development teams that make up the application. The Front end is what you see when you look at an application and are responsible for providing a user interface to your users, so they can interact with it by clicking on elements and browsing between pages. The Back end contains all the business logic that manages data sources and users. It consists of all the SQL database that stores your data.
Front End: All software components and web-based applications used to interact with the data and documents of Qlikview are included in the front-end portion of the QlikView architecture. The front-end layer lets the user access QlikView reports and connects live data sources with a simple drag-and-drop function.
Back End: The QlikView developer and the QlikView publisher make up the back-end component, also called the application platform. The QlikView documents and other files are stored in a variety of formats. The application platform receives any request to connect to or access a data source and uses QlikView Publisher to share the data.
Features of QlikView
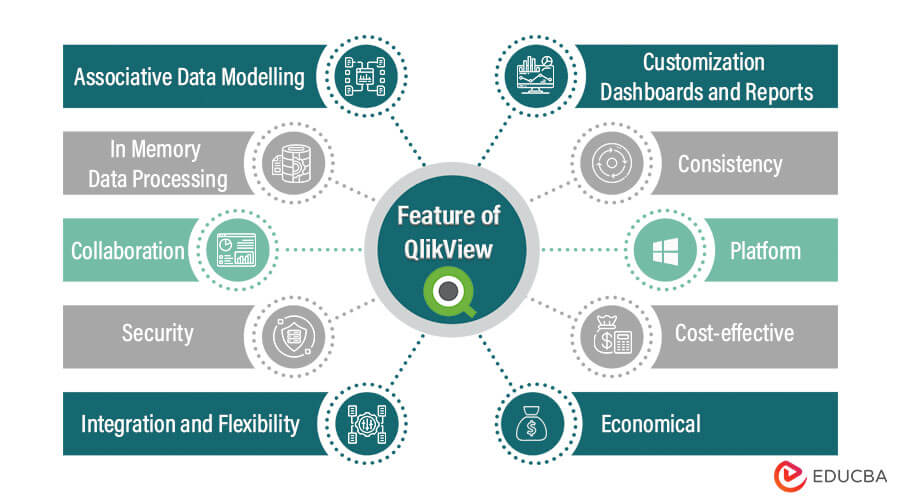
Below the screenshot, we can see the features of QlikView.
Associative Data Modelling: This feature allows users to explore data in a non-linear way and makes it easy to create dashboards, import data, and create insights. It enables users to navigate easily through data without being confined by predefined paths or hierarchies.
Collaboration: Data visualization is one of the most important reports that users can share insight with others.
In Memory Data Processing: Stores data in a memory, which enables fast data processing and analysis. This feature allows users to work with large data sets in real-time without the need for complex tuning or indexing.
Security: QlikView provides a safe environment for the user because it uses sensitive corporate data.
Integration and Flexibility: QlikView provides flexibility to the user, which means they can build the dashboard and use the script for mapping as per their requirements.
Customization Dashboards and Reports: Qlilview allows you to create dynamic dashboards, reports, and charts with drag-and-drop functionality that enables you to make smart decisions.
Consistency: Helps users navigate the application and interpret the data more easily. It also contributes to maintaining a professional and cohesive user experience, which can improve adoption and engagement with the application.
Platform: QlikView is available only on the Windows platform.
Cost-effective: It provides highly cost-effective options.
Economical: It is very inexpensive with a disk which means it uses the required space.
Working with QlikView
Some critical utility has been provided below:
- Loading huge data.
- Helping on load and transferring required data from different data sources.
- Load scripts help to store information on the data and the specific data sources from where those data came.
- And one of the big utilities is if the business user wants to use only the QlikView file and is willing to analyze on the same for preparing the analytics report, then they don’t need to open the script file at all. They can directly utilize the same without any changes.
Component of QlikView
Basically, there are three main components which are as below.
- QlikView Desktop
- QlikView Server
- QlikView Publisher
Normally, with the help of the above components, we can easily design, develop, and implement the QlikView application.
QlikView Desktop
A development tool for Windows. Developers use it to create the QlikView data model and graphical user interface (GUI) layout for the application’s front end. Data is prepared by the developer for use by the user in the desktop environment. They use SQL-like scripting to alter the data set. Code scripting allows developers to establish connections between data fields and values. Additionally, the data can be altered. Another QlikView application can use and share the files created with the Qlikview desktop.
QlikView Server
The desktop version’s applications are hosted on QlikView Server (QVS), where users can access them from any location. Clients and end users communicate with one another through a QlikView server. The QlikView server provides a robust QLX engine that facilitates effective in-memory data analysis, data management, distribution, consolidation, scaling, and access. The QVS server transfers data files from the backend to the front end.
QlikView Publisher
It is an optional mobile device for the QlikView server-side component. You can load data directly into QlikView files and retrieve data from standard data files or Salesforce using this component. It lets you schedule and manage tasks so that you can distribute data. By efficiently disseminating data, It also aids in traffic and data load reduction.
Management Console
The platform that manages all of the other QlikView components centrally is called the QlikView Management Console. It consists of a server-side application controlled by IT professionals and a web-based interface.
User Access: This is the user access point, which helps to access or manipulate the different data files. Users can use different access points such as desktops, mobile devices, and laptops.
Advantages of QlikView
Some of the key advantages:
- It mainly used the in-memory model of storing data.
- Able to handle or modify some huge data sets very smoothly and ensure accuracy.
- Strong data filtering module.
- The strong searching mechanism on all the data sets, whether data is available directly or indirectly.
- Holding one of the faster and more powerful visualization capabilities compared with any other business discovery platform.
Disadvantages of QlikView
- Basically, QlikView is not useful for real-time data analysis compared to the other tools.
- For heavy datasets, we have a limit for computer RAM.
- It required scriptwriting as well as R programming languages.
- As compared to the other tool, it lacks some latest features.
How to download and install QlikView
Now let’s see how to download QlikView as below.
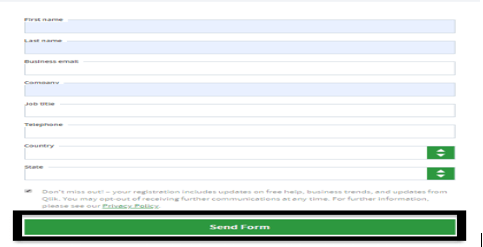
Step 1. First, we need to open the QlikView website and complete the registration as shown in the below screenshot.
Step 2. We can download QlikView through the download button, which is present at the bottom of the page, as shown in the screenshot below.
Step 3. In the step, we need to click on the download button and select language for installation as shown in the below screenshot.
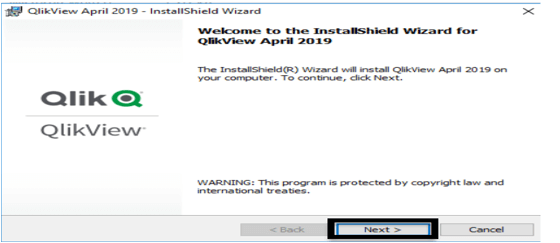
Step 4. Click on the Next button for the installation screen, as shown in the below screenshot.
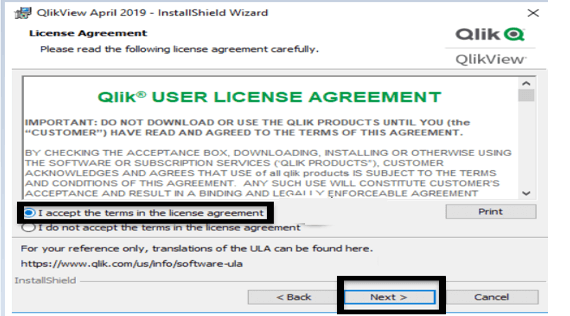
Step 5. Accept the terms and conditions of the license and click on the next button, as shown in the below screenshot.
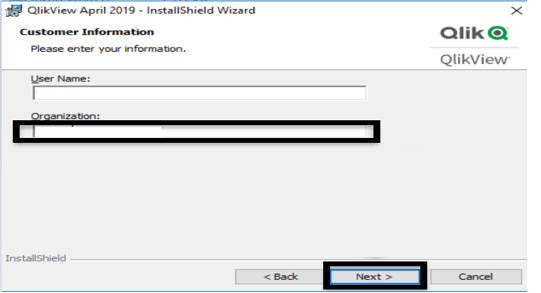
Step 6. In the next step, we need to add the user name and organization name as shown in the below screenshot.
Step 7. Select the destination folder and check the complete radio button, as shown in the below screenshot.
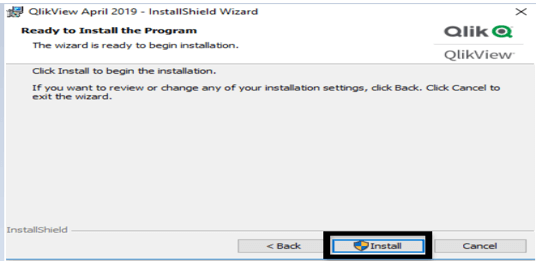
Step 8. Click on the “install” button, and the installation process will be started as shown in the below screenshot.
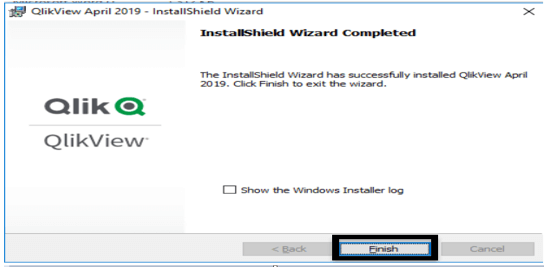
Step 9. After completion, we get the finish button, as shown in the below screenshot.
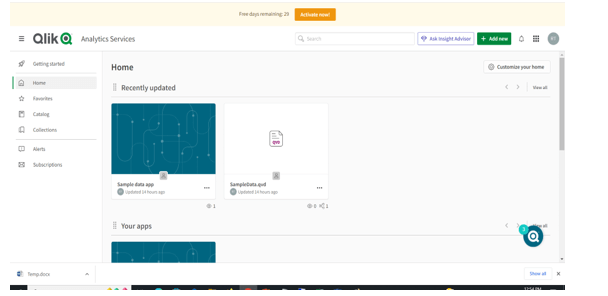
Step 10. After completion, we get the QlikView dashboard which is shown in the below screenshot.
Required skills
Some of the key knowledge may require to understand it faster:
- SQL query knowledge at the basic level requires.
- VB script knowledge is sometimes required in the case of advanced automation or macros utility.
- Basic data model knowledge will be helpful.
- Understanding of huge data type.
- Strong business understanding, specifically in the case of writing rules.
- Designing specific layouts.
- Hard-working and proper practice will be the key points for any new tool.
Why should we use QlikView?
It mainly utilizes for storing government-related important data and ensuring security. As Tool is really easy to use for any kind of business use for developing their own report immediately, so it always is an enterprise-ready product. It holds some of the critical governed data and specific rules, so it provides utility for all the other organizations using those government-specific data and defining rules properly at the time of analysis.
Application of QlikView
- It helps us analyze the revenue data, which depends on the various filters.
- We can create a very detailed report that is based on social media.
- With the help of QlikView, we can create the prediction of cause and effect with graphics.
- By using QlikView, we can analyze the sales, production, and shipping data.
Scope
QlikView is a popular business intelligence tool that offers flexible navigation tools and powerful visualization capabilities; there have different kinds of opportunities available in the current market. Experienced candidates can able to expertise their knowledge specifically in advanced levels like VB script or JavaScript or macros kind of thing. Or they can easily plan for specific certification QlikView Developer or Administrative part. Otherwise, any other popular BI tool or data warehousing, or ETL tools will be some great options for them.
Why do we need QlikView?
Some of the key reasons for using it are:
- Cost-Effectiveness. Compared to other available popular business intelligence tools, It offers better visualization capabilities at a lower cost.
- Very much user-friendly. So easy to understand for business people without any specific technical background.
- It does not use any kind of cube concept. Load all the original tables and data.
- Holding data in memory for further use.
QlikView Navigation
QlikView provides a number of navigation tools that allow users to easily explore and analyze their data. Here are some of the key navigation features :
- Sheet Navigation Bar: The Sheet Navigation Bar is located at the bottom of the QlikView interface and allows users to navigate between different sheets within the document. It provides a thumbnail view of each sheet, and users can click on a thumbnail to switch to that sheet.
- Bookmark Toolbar: The Bookmark Toolbar is located at the top of the QlikView interface and allows users to save and access bookmarks of their favorite or most frequently used views of their data. Users can add a bookmark by clicking the star icon and can access their saved bookmarks by clicking the drop-down arrow next to the star icon.
- Search Object: The Search Object allows users to search for specific data values within a sheet or object. Users can enter a search term in the search box, and the tool will highlight any matching values in the data.
- Tabbed Objects: QlikView allows users to open its objects, such as charts, tables, and lists in tabs within the document, making it easy for them to switch between different views of their data. Users can simply click on a tab to bring the corresponding object to the front of the document.
- Drill Down/Up: Drill Down/Up allows users to explore data at different levels of granularity by clicking on different dimensions in a chart or table. Users can drill down to see more detailed information or drill up to see higher-level summaries.
- Selections Bar: The Selections Bar in QlikView allows users to view and manage their selections. This includes the ability to clear selections, select all values, or exclude specific values.
- Back and Forward Buttons: QlikView includes Back and Forward buttons that allow users to navigate through their selections and views of their data. This can be useful for exploring data and analyzing different scenarios, as users can easily move back and forth between different selections without having to recreate them manually.
How will this technology help you in career growth?
Moreover, as QlikView is a widely recognized and powerful business intelligence tool, having experience with it can open up various opportunities for the candidate to work with multiple other BI intelligence tools.
There has been some option of taking certification in QlikView for entertaining their career growth anytime. However, to fully utilize the advanced features of QlikView, it is recommended to learn some key related technologies such as VB Script or JavaScript. By doing so, users can leverage the capabilities of these technologies to enhance their data analysis and visualization. This can lead to a more efficient and effective approach to working with the tool, ultimately leading to better insights and outcomes.
Conclusion
It allows different companies on multiple businesses to analyze entire market data to identify which specific activities will help them for better sales in the current scenario. It can provide faster results and a properly flexible approach so that organization sales and marketing people can target their approach of selling more smartly based on the analyzed result.
Recommended Articles
This has been a guide to What is QlikView? Here we discussed the history, architecture, features, components, Scope, Advantages, and disadvantages. You can also go through our other suggested articles to learn more –
