Updated May 19, 2023

What is SSRS?
SSRS or SQL Server Reporting Services is one of the tools available in Microsoft SQL Server Data Tools. Users use it to generate, access, and maintain reports in any form or shape, such as pie charts, bar charts, tables, graphs, and images. For a person to work on SSRS, it is important to download and install the supporting applications, including the SQL Server Data Tools, SQL Server Database Engine, and a sample database from Microsoft,’ Adventure Works 2014’.
Pre-requisite
To work with it, below are the pre-requisites that you should have as a part of the software:
- SSDT – SQL Server Data Tools
- SQL Server Database Engine
- AdventureWorks2014 Database
To install SSDT, please follow the below link:
https://learn.microsoft.com/en-us/sql/ssdt/download-sql-server-data-tools-ssdt?view=sql-server-2017
The link for the AdventureWorks2014 Database can be found here:
https://github.com/Microsoft/sql-server-samples/releases
Working and Architecture
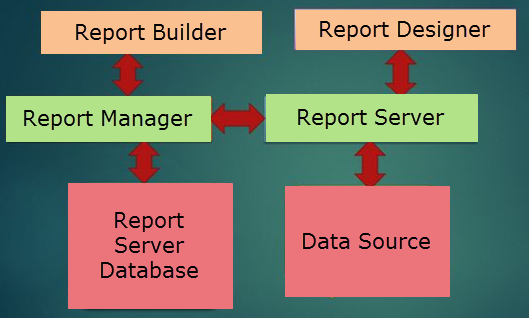
Following is working and architecture:
The main components of SSRS are the following:
- Report Builder – Users use this component as a drag-and-drop utility to pick any functionality or tables and drag them as needed. It runs on the client’s computer.
- Report Designer – Developers use this component to develop reports. They can develop complex reports with ease using this component. It is a publishing tool hosted in SSDT (SQL Server Data Tools) or Visual Studio.
- Report Manager – To access any web-based reports, we can use Report Manager.
- Report Server – This component is used to store SQL server Engine metadata.
- Server Database Report – This component stores security settings, report definitions, metadata, delivery data, etc.
- Data Sources – The reporting service components retrieve data from multidimensional, relational, or traditional data sources.
Downloads and Installation
The following are downloads and installation:
1. SSDT with Visual Studio 2017
- Follow the below link to install Visual Studio:
https://learn.microsoft.com/en-us/visualstudio/install/install-visual-studio?view=vs-2019
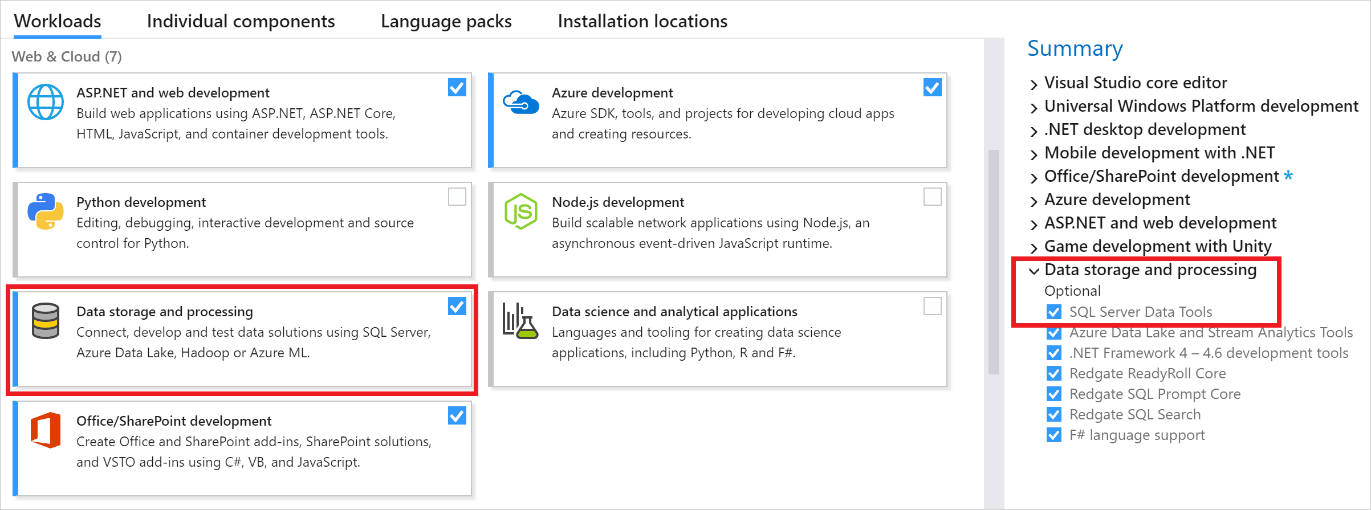
- Now to install SSDT (and hence SSRS), go ahead and run the Visual Studio installer; on the coming screen, please select the Data Storage and Processing Workload, and then from the summary, checkbox “SQL Server Data Tools”.
Image Source: https://docs.microsoft.com/en-us/sql/ssdt/media/download-sql-server-data-tools-ssdt/data-workload.png?view=sql-server-2017
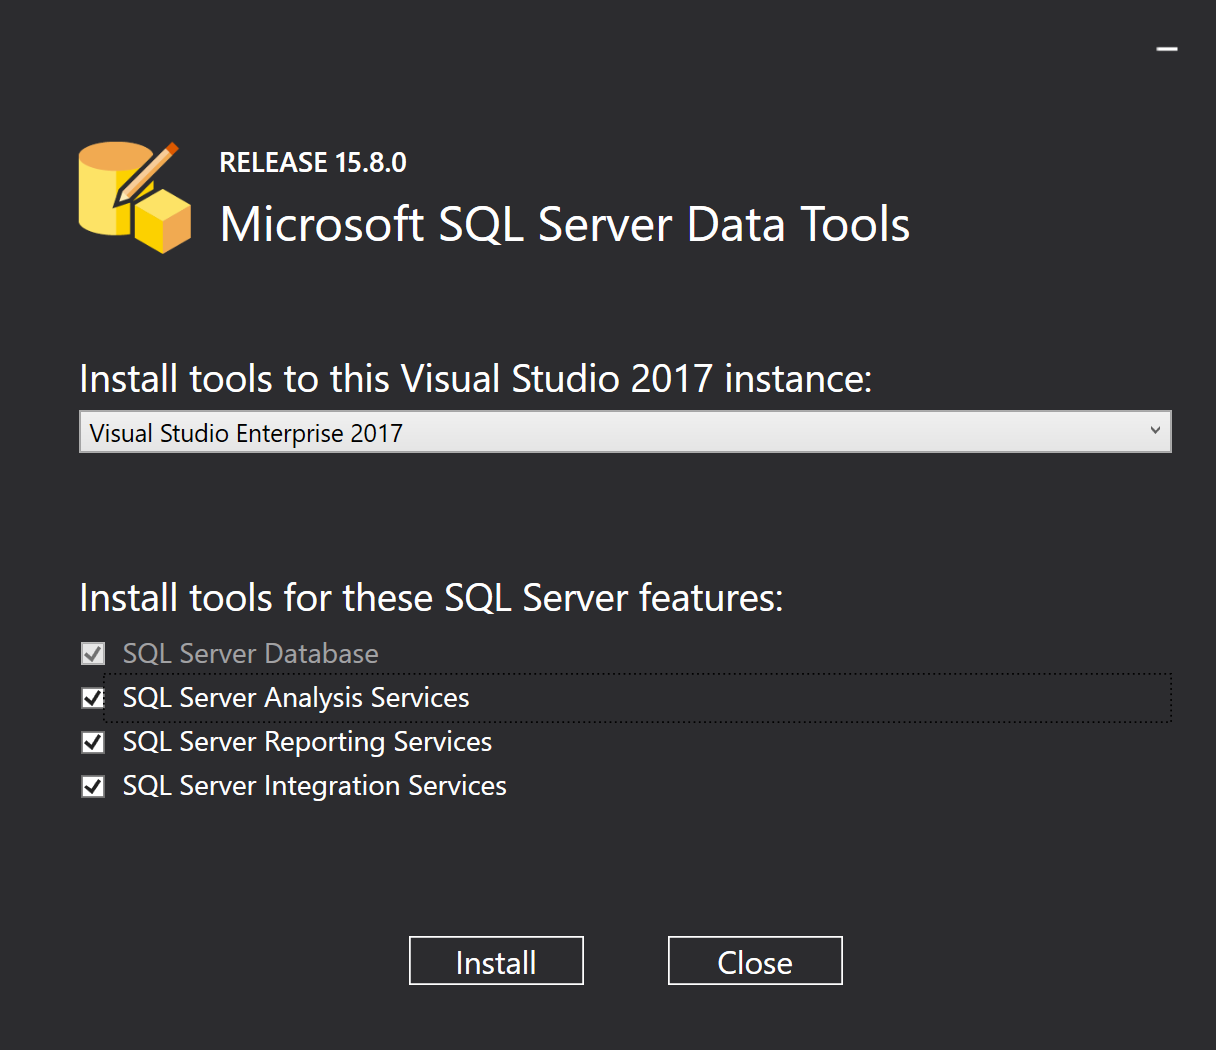
2. SSDT Standalone Installation
- You can also install SSDT as a standalone installation by downloading from the below link:
https://go.microsoft.com/fwlink/?linkid=2052454
- Also, before you install SSDT for VS 2017, please uninstall Analysis and Reporting Services project extensions.
Various Types of SSRS Reports
The various types of reports creation that are available through SSRS are:
- Parameterized Report – This report is based on the input values. Users frequently use parameterized reports to create reports such as drill-down reports, linking, subreports, and filtering.
- Linked Reports – This report provides access to an existing report and is a report server item. It is derived from a current report.
- Cached Reports – Cached reports can be used to create a copy of processed reports. By creating a copy, we can enhance performance by reducing the number of processing requests.
- Snapshot Reports – These reports contain the executed query results and layout information. The reports are not saved anywhere but rendered in a viewing format (like HTML) as and when a user or an application requests it.
- Sub Reports – A report within a report. A subreport presents you with another report within the body of the main report. For a subreport, one can use several data sources than the main report.
- Drilldown Reports – Drilldown reports allow users to control and enable them to see the data they want. This way, it handles the complexity of the report.
- Drillthrough Reports – Drillthrough reports are accessed via a hyperlink through the original report.
Export Options for SSRS Reports
There are several options available for report rendering in SSRS:
- CSV
- XML
- Excel
- HTML
- Acrobat
- As an image
Advantages
- Faster and cheaper report generation on relational as well as cube data.
- It comes free with a MySQL server.
- It is server-based; hence it can build and distribute the reports online.
- Users have access to enterprise-level features. For example, connecting to many data sources, connectivity to MS SQL, Excel, Oracle, etc.
- It has a huge support community.
- It is easy to deploy centralized reporting using it.
- A significant specialized skill set is not required to get started with it.
- It enabled faster delivery of reports to businesses.
- It allows XML-based report definition where you can render your reports directly. Other rendering options exist besides XML, like HTML, CSV, etc.
- The role-based method effectively manages security and can implement for folders and reports.
- The report designer integrates with Visual Studio.NET, allowing users to create the application and reports within the same environment.
Disadvantages
- It is resource-consuming if you ARE RUNNING LARGE REPORTS. It may consume much of your server resources.
- It runs only on Windows, which thereby causes some limitations to its usage.
- Its interface is becoming outdated.
- Upgrading SSRS poses a difficult task.
- Reports need Parameters to be accepted by the user.
- Power BI, another reporting tool from Microsoft, is taking over SSRS.
- The output you desire determines the disabling of certain features. For example, if you output HTML, no pagination would be available. Similarly, drill-down options are not provided for XML and CSV.
- It will not allow adding a page number in the body of the report.
Recommended Articles
We hope that this EDUCBA information on “What is SSRS?” was beneficial to you. You can view EDUCBA’s recommended articles for more information.


