Updated February 28, 2023

Introduction to Windows PowerShell ISE
Windows PowerShell ISE is the scripting environment for developing and running PowerShell cmdlets and scripts. It is the interface in which the scripts or cmdlets can be run, debug and tested. It is very useful to use as it has different colors for keywords, which makes the user differentiate between keywords and variables. It also has IntelliSense feature like the one available in visual studio that suggests for the related objects/functions associated with an object. The first version was introduced with Windows PowerShell Version 2 and redesigned in version 3. Now ISE is supported in all Windows PowerShell versions up to 5.1. PowerShell ISE can be started by selecting the start and Windows PowerShell ISE or can be opened by typing powershell_ise.exe in the run box or command Prompt.
Windows PowerShell ISE Requirements
Starting from Windows XP, the PowerShell can run on all the versions of windows. It is not supported in Server core installations. It requires .Net framework 3.5 or above to be installed, if the .Net framework is not installed it will be installed automatically during ISE installation by the server manager.
Analyzing the PowerShell ISE Design
The following are the components:
- Menu Bar
- Tabs
- Toolbar
- Console Pane
- Status Bar
- Script Pane
- Help Section
Menu Bar: The menu bar has options to create, open or edits a file. It also has menus for Tools, Debug and Help.
Tabs: A tab is nothing but the place where the script runs. A maximum of 8 tabs can be kept open simultaneously.
ToolBar: The toolbar has the following buttons:
- New: To create a new script
- Open: Opens an existing script
- Save/cut/copy/paste: To save a script and options for cut, copy and pasting of scripts
- Run: To execute a script
- Stop: To stop the execution
Along with the above mentioned, there are buttons for undoing and redoing, clearing output pane and creating a new tab for remote sessions
- Script Tab: The script editing is done here. It has the current script name and when hovered over displays the location of the script.
- Output Pane: Results are displayed here.
- Command Pane: Command or commands can be run here. To run multiline commands, presssshift+Enter after each command for a new line and enter finally to execute them. The command pane has the location of the current working directory.
- Status Bar: Displays the status of the script. Errors or success message is displayed after each execution.
- Help: Help menu has the library or files for all the available commands. It can be opened by pressing the F1 key also. The help guides how a cmdlet must be constructed, the necessary parameters required and their type.
- Establishing Remote Connection: Using PowerShell, it is easy to run the script on a remote computer. This is one of the underrated features of PowerShell that is unknown to many. To run a script on the remote computer, click on New remote PowerShell tab under the file menu, it prompts for the details of the remote computer.
Debugging Scripts in PowerShell ISE
Debugging is the act of pausing the execution of a script at a designated place to examine the values of a variable or a function at that point. This helps in examining the errors or check for the correct logical flow of the script. The place where the execution is paused is called a breakpoint. As soon as, a breakpoint is reached in a script, the execution is paused.
Once paused, we can hover over the values of a variable to know its current value or we can run a command or enter the variable name in the console pane to know the value. Any value of the variable that is within the context of the running script can also be modified. Once all the details are examined, the script can be resumed. An important thing to remember is that the breakpoints can be inserted only after a script is saved.
There are three types of the breakpoint in PowerShell ISE:
- Line Breakpoint: The script is paused when the desired line is reached.
- Variable Breakpoint: The script is paused when the desired variable’s value is changed.
- Command Breakpoint: Whenever the designated command is to be run, the script is paused.
Setting a Breakpoint: A breakpoint can be set up in two ways.
- Right-Click on the line where the execution must be paused and select Toggle breakpoint.
- Pressing F9 will insert a breakpoint on the line.
To set a variable breakpoint, execute the below in the console pane
Set-PSBreakpoint -Script test.ps1 -Variable test
The above sets a breakpoint on the variable test.
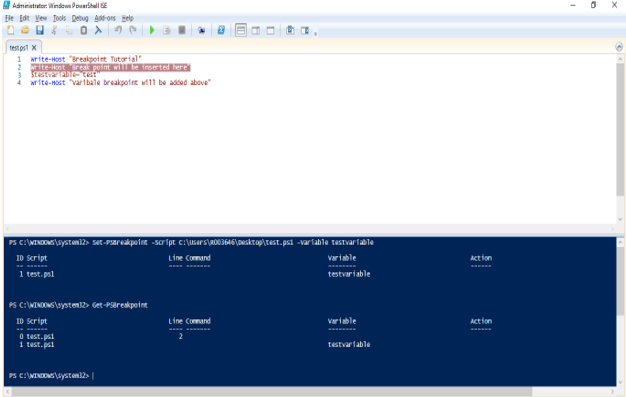
To display, the list of breakpoints in the current session, the Get-PSBreakPoint cmdlet can be run on the console pane.
Code:
Write-Host "Breakpoint Tutorial"

Write-Host "Break point will be inserted here"

$testvariable = "test"

Write-Host "Variable breakpoint will be added above"
Output: In the below example, there are two breakpoints. One is set using the cmdlet and the other is set using F9.
Removing a Breakpoint
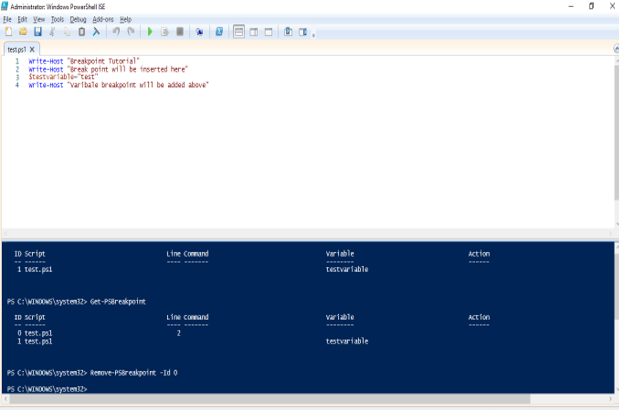
To remove a breakpoint, right-click on the line and select toggle breakpoint. It can also be removed from the console pane by using the id as below.
Remove-PSBreakpoint -Id 0
See the below image where the breakpoint is removed
Code:
Write-Host "Breakpoint Tutorial"

Write-Host "Break point will be inserted here"

$testvariable = "test"

Write-Host "Variable breakpoint will be added above"

Remove-PSBreakpoint -Id 0
Output:
1. To remove all breakpoints in the current session, select remove all breakpoints under the debug menu or press ctrl+shift+F9 or run the below cmdlet in console pane.
Get-PSBreakpoint | Remove-PSBreakpoint
2. A breakpoint can also be disabled instead of removing it completely so that it can be enabled later using the below cmdlet using its id
Disable-PSBreakpoint -Id 1
3. To disable all breakpoints, use the below cmdlet
Get-PSBreakpoint | Disable-PSBreakpoint
4. For enabling a breakpoint to use the below cmdlet
Enable-PSBreakpoint -Id 10
To enable all the breakpoints, click on the debug menu and select enable all breakpoints.
Walkthrough of a Debugging Session
- To run a script, press F5. The script will pause once a breakpoint is reached.
- To continue after a breakpoint, press F5 or type c in the control pane and enter.
- To view the stack trace, press ctrl+shift+D or in the console pane, type K.
- To step into a function, press F11.
- To step over a function, press F10.
- To stop debugging, press shfi+F5.
Conclusion
Thus, the article covered in detail about Windows PowerShell Ise. It explained the various features available, the running and debugging of a script. It covered in detail on the various debugging options available and how to execute them. To understand more in detail, it is advisable to explore the ISE by running various example scripts.
Recommended Articles
This is a guide to Windows PowerShell ISE. Here we discuss an introduction, requirement and debugging of a script in detail and how to execute them. You can also go through our other related articles to learn more –


