Updated June 5, 2023
Z Score Formula (Table of Contents)
What is Z Score Formula?
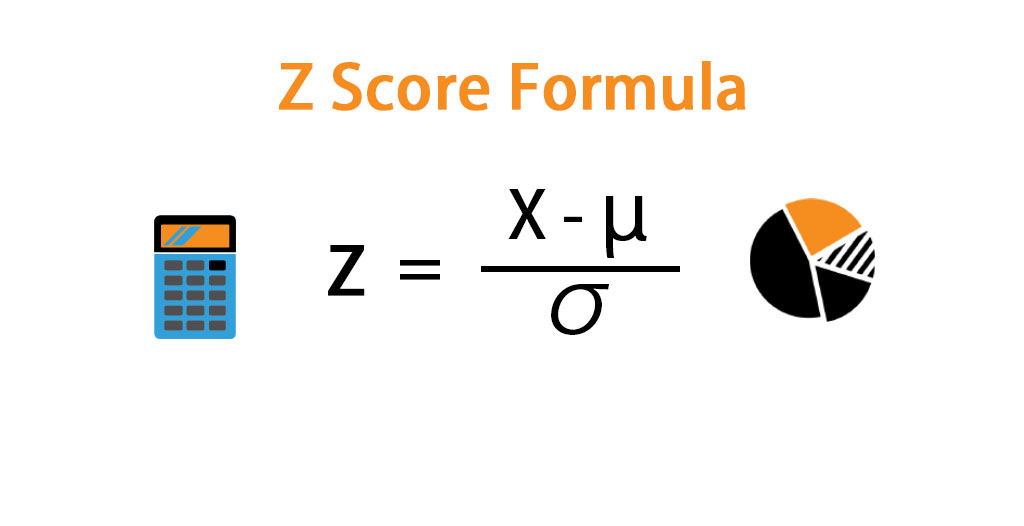
The “Z score” is one of the most widely used statistical tools to standardize score, provided population means, and the standard deviation is known. As such, the Z score is also known as the standard score. The Z score varies in the range of -3 times the standard deviation to +3 times the standard deviation, with a mean of zero and a standard deviation of one. The formula for the Z score of a variable can be derived by deducting the Mean of the population from the given Variable (which is a part of the data set or population) and then dividing the result by the standard deviation of the population.
Mathematically, it is represented as:
where,
- X = Variable from the population.
- μ = Mean of the population.
- σ = Standard deviation of the population.
Examples of Z Score Formula (With Excel Template)
Let’s take an example to understand the calculation of the Z Score in a better manner.
Z Score Formula – Example #1
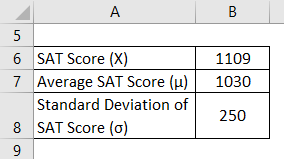
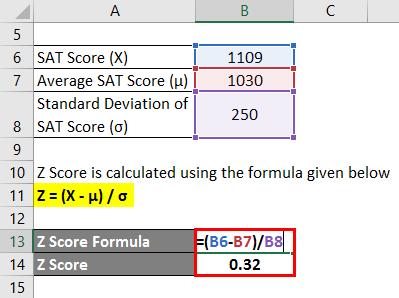
Let us take the example of Manny, who recently appeared for SAT. He managed to score 1109 in this attempt. However, as per available information, the average score for SAT remained around 1030 with a standard deviation of 250. Therefore, calculate the Z score for Manny’s SAT score and assess how well he did compare to the average test-takers.
Solution:
Z Score is calculated using the formula given below:
Z = (X – μ) / σ
- Z score = (1109 – 1030) / 250
- Z Score = 0.32
Therefore, Manny’s SAT score is 0.32 standard deviation higher than the average test-taker score, which indicates that 62.55% of the test-takers scored less than Manny.
Z Score Formula – Example #2
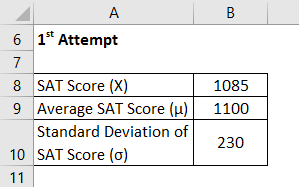
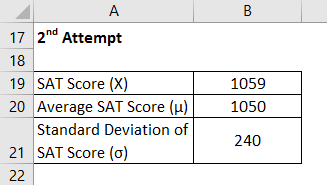
Let us take the example of Chelsea, who has written the SAT twice and wants to compare her performance in them. She scored 1085 and 1059 on her 1st and 2nd attempts, respectively. According to available information, the average score and standard deviation during the 1st attempt were 1100 and 230, respectively, while in the latter, it was 1050 and 240, respectively. Please help Chelsea to decide in which exam did she perform better.
Solution:
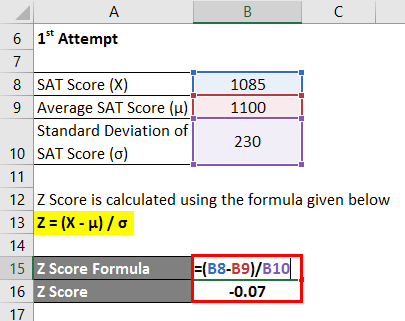
1st attempt
Z Score is calculated using the formula given below:
Z = (X – μ) / σ
- Z score = (1085 – 1100) / 230
- Z Score = -0.07
Therefore, Chelsea’s SAT score on 1st attempt is 0.07 standard deviation lower than the average test-taker score, which indicates that 47.40% of the test-takers scored less than Chelsea during the 1st attempt.
2nd attempt
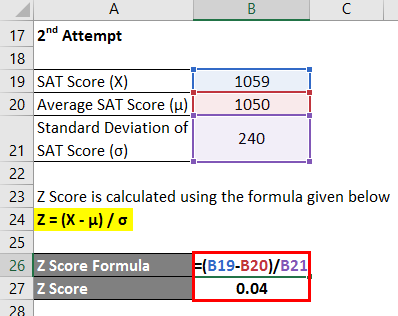
Z Score is calculated using the formula given below:
Z = (X – μ) / σ
- Z score = (1059 – 1050) / 240
- Z Score = 0.04
Therefore, Chelsea’s SAT score on the 2nd attempt is 0.04 standard deviation higher than the average test-taker score, which indicates that 51.50% of the test-takers scored less than Chelsea during the 2nd attempt.
So, comparing the Z scores indicates that Chelsea performed better during her 2nd attempt.
Explanation
The formula for the Z score can be derived by using the following steps:
Step 1: Firstly, build a population with many variables and the variables denoted by Xi.
Step 2: Next, we calculate the number of variables in the population and denote it as N.
Step 3: Next, we calculate the population’s Mean by summing up all the variables and dividing by the total number of variables (step 2) in the data set. We denote the Mean of the population as μ.
μ = ∑ Xi / N
Step 4: Next, deduct the Mean from each data set Variable to calculate their deviation from the Mean.
i.e., (Xi – μ) is the deviation for the ith data point.
Step 5: Next, calculate the squared deviations for the variables, i.e. (Xi – μ)2.
Step 6: Add all the squared deviations and divide the total by the number of variables in the data set to determine the variance.
σ2 = ∑(Xi – μ)2 / N
Step 7: Next, we calculate the population’s standard deviation by taking the square root of the variance calculated in the above step.
σ = √ ∑(Xi – μ)2 / N
Step 8: Finally, we derive the formula for the Z score by subtracting the Mean of the population (step 3) from the Variable and then dividing the result by the standard deviation of the population (step 7), as shown below.
Z = (X – μ) / σ
Relevance and Uses of Z Score Formula
From a statistician’s perspective, the concept of the Z score is very important as it helps determine the probability of whether or not an event will occur within a normal distribution. The Z score also compares two raw scores from two different normal distributions by converting the raw scores into Z scores or standardized scores. Further, a positive Z score implies a score higher than the Mean, while a negative Z score implies a score less than the Mean.
Z Score Formula Calculator
You can use the following Z Score Formula Calculator
| X | |
| µ | |
| σ | |
| Z | |
| Z = |
|
|
Recommended Articles
This has been a guide to Z Score Formula. Here we discuss how to calculate Z Score along with practical examples. We also provide a Z Score calculator with a downloadable Excel template. You may also look at the following articles to learn more –
